

本頁說明如何擷取查詢執行資訊。
使用「查詢說明」
您可以使用「查詢說明」瞭解查詢的執行方式。 這項資訊可協助您最佳化查詢。
您可以使用 Google Cloud 控制台或 explain 指令,執行查詢說明。
控制台
在查詢編輯器中執行查詢,然後開啟「說明」分頁:
-
前往 Google Cloud 控制台的「資料庫」頁面。
- 從資料庫清單中選取 Cloud Firestore 資料庫。 Google Cloud 控制台會開啟該資料庫的「Firestore Explorer」(Firestore 探索工具)。
- 在查詢編輯器中輸入查詢,然後點選「Run」(執行)。
-
按一下「說明」分頁標籤,即可查看查詢分析輸出內容。
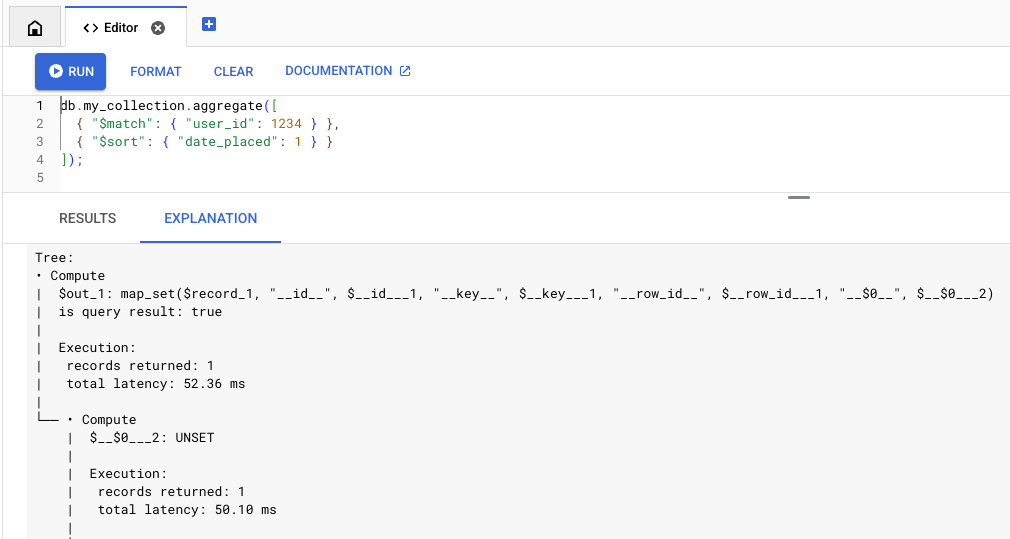
MongoDB API
MongoDB API 中的 Query Explain 可透過 explain 指令支援,您可以在 Mongo Shell 和 Compass 等工具中使用這項指令。
explain 指令支援 aggregate、find、distinct 和 count 指令,例如:
db.collection.explain('executionStats').find(...)
您也可以使用 explain() 方法,例如:
db.collection.find({QUERY}).explain('executionStats')限制
請注意下列限制和差異:-
查詢說明不支援傳回游標的指令。舉例來說,系統不支援直接呼叫下列指令來叫用說明:
db.collection.aggregate(..., explain: true)
查詢說明僅支援
find、aggregate、count、distinct、update、delete和findAndModify指令。-
查詢說明支援
executionStats、allPlansExecution和queryPlanner詳細程度模式。queryPlanner:只會傳回執行計畫,不會執行查詢,executionStats和allPlansExecution:傳回執行計畫,以及帳單、記憶體和執行統計資料。
如未指定詳細程度模式,殼層會預設為
queryPlanner。如要查看完整的執行統計資料,請指定executionStats或allPlansExecution詳細程度模式。
分析
查詢說明的輸出內容包含兩個主要元件:摘要統計資料和執行樹狀結構。以這個查詢為例:
db.orders.aggregate(
 [
   { "$match": { "user_id": 1234 } },
   { "$sort": { "date_placed": 1 } }
 ]
)
摘要統計資料
說明輸出內容的頂端會顯示執行統計資料摘要。 根據這些統計資料,判斷查詢是否延遲時間過長或費用過高。此外,這份報表也包含記憶體統計資料,可讓您瞭解查詢作業是否即將達到記憶體限制。
Execution:
 results returned: 35
 query id: 7e7b37ea1a259d79
 request peak memory usage: 45.56 KiB (46,656 B)
 data bytes read: 24.58 KiB (25,175 B)
 entity row scanned: 265

Billing:
 read units: 7
執行樹狀結構
執行樹狀結構會將查詢執行作業描述為一系列節點。底部的節點 (葉節點) 會從儲存層擷取資料,並向上遍歷樹狀結構,以產生查詢回應。
如要進一步瞭解每個執行節點,請參閱「執行參考資料」。
如要瞭解如何運用這項資訊最佳化查詢,請參閱「最佳化查詢執行作業」。
以下是執行樹狀結構的範例:
Execution:
 results returned: 35
 query id: 7e7b37ea1a259d79
 request peak memory usage: 45.56 KiB (46,656 B)
 data bytes read: 24.58 KiB (25,175 B)
 entity row scanned: 265

Billing:
 read units: 7

Tree:
• Compute
|  $out_1: map_set($record_1, "__id__", $__id___1, "__key__", unset)
|  is query result: true
|
|  Execution:
|   records returned: 35
|   latency: 204.87 ms (local 7.64 ms)
|
└── • Compute
    |  $__id___1: _id($__key___2)
    |
    |  Execution:
    |   records returned: 35
    |   latency: 197.23 ms (local 2.04 ms)
    |
    └── • MajorSort
        |  fields: [$v_5 ASC]
        |  output: [$__key___2, $record_1]
        |
        |  Execution:
        |   records returned: 35
        |   latency: 195.20 ms (local 28.42 ms)
        |   peak memory usage: 45.56 KiB (46,656 B)
        |
        └── • Compute
            |  $v_5: offset($v_4, 0L)
            |
            |  Execution:
            |   records returned: 35
            |   latency: 166.78 ms (local 14.84 ms)
            |
            └── • Compute
                |  $v_4: sortPaths(array($date_placed_1), [date_placed ASC])
                |
                |  Execution:
                |   records returned: 35
                |   latency: 151.94 ms (local 5.43 ms)
                |
                └── • TableScan
                       source: **/orders
                       order: STABLE
                       filter: $eq($user_id_1, 1,234)
                       output bindings: {$__key___2=row().__key__, $date_placed_1=row().date_placed, $record_1=row[* - { __create_time__, __update_time__ }](), $user_id_1=row().user_id}
                       output: [$__key___2, $date_placed_1, $record_1]

                       Execution:
                        records returned: 35
                        latency: 146.50 ms
                        data bytes returned: 3.25 KiB (3,325 B)
                        post-filtered rows: 230
                        records scanned: 265
                        data bytes read: 24.58 KiB (25,175 B)