
Google Cloud 外掛程式會將 Firebase Genkit 的遙測資料和記錄資料匯出至 Google Cloud 作業套件
安裝
npm i --save @genkit-ai/google-cloud如果您想在本機執行使用此外掛程式的流程,還必須安裝 Google Cloud CLI 工具。
設定 Google Cloud 帳戶
您必須具備 Google Cloud 帳戶 (如果您還沒有帳戶,請先註冊) 和 Google Cloud 專案,才能使用這個外掛程式。
新增外掛程式前,請確認專案已啟用下列 API:
專案的 API 資訊主頁中應會列出這些 API。
如要進一步瞭解如何啟用及停用 API,請按這裡。
Genkit 設定
如要啟用匯出至 Google Cloud Tracing、Logging 和 Monitoring 的功能,請將 googleCloud 外掛程式新增至 Genkit 設定:
import { googleCloud } from '@genkit-ai/google-cloud';

export default configureGenkit({
  plugins: [googleCloud()],
  enableTracingAndMetrics: true,
  telemetry: {
    instrumentation: 'googleCloud',
    logger: 'googleCloud',
  },
});
在實際工作環境中執行時,系統會自動匯出遙測資料。
驗證
外掛程式需要 Google Cloud 專案 ID 和 Google Cloud 專案憑證。如果您透過 Google Cloud 環境 (Cloud Functions、Cloud Run 等) 執行流程,系統會自動設定專案 ID 和憑證。
應用程式預設憑證
如要在其他環境中執行作業,你必須將 GCLOUD_PROJECT 環境變數設為 Google Cloud 專案,並使用 gcloud 工具進行驗證:
gcloud auth application-default login如需詳細資訊,請參閱「應用程式預設憑證」說明文件。
服務帳戶憑證
如果您使用服務帳戶,而且在 Google Cloud 以外的環境執行,可以將憑證設為環境變數。按照操作說明設定 Google Cloud 服務帳戶金鑰。
下載金鑰檔案後,您可以使用 GOOGLE_APPLICATION_CREDENTIALS 環境變數指定檔案位置,或直接將 JSON 檔案的內容複製到環境變數 GCLOUD_SERVICE_ACCOUNT_CREDS,以兩種方式指定憑證。
檔案路徑:
GOOGLE_APPLICATION_CREDENTIALS = "path/to/your/key/file"
直接複製:
GCLOUD_SERVICE_ACCOUNT_CREDS='{
  "type": "service_account",
  "project_id": "your-project-id",
  "private_key_id": "your-private-key-id",
  "private_key": "your-private-key",
  "client_email": "your-client-email",
  "client_id": "your-client-id",
  "auth_uri": "https://accounts.google.com/o/oauth2/auth",
  "token_uri": "https://accounts.google.com/o/oauth2/token",
  "auth_provider_x509_cert_url": "https://www.googleapis.com/oauth2/v1/certs",
  "client_x509_cert_url": "your-cert-url"
}'
外掛程式設定
googleCloud() 外掛程式會採用選用的設定物件:
{
    projectId?: string,
    telemetryConfig?: TelemetryConfig
}
專案 ID
這個選項可讓您明確指定 Google Cloud 專案 ID。但在大多數情況下,您不必這麼做。
遙測設定
這個選項會設定 OpenTelemetry NodeSDK 執行個體,
import { AlwaysOnSampler } from '@opentelemetry/sdk-trace-base';

googleCloud({
  telemetryConfig: {
    forceDevExport: false, // Set this to true to export telemetry for local runs
    sampler: new AlwaysOnSampler(),
    autoInstrumentation: true,
    autoInstrumentationConfig: {
      '@opentelemetry/instrumentation-fs': { enabled: false },
      '@opentelemetry/instrumentation-dns': { enabled: false },
      '@opentelemetry/instrumentation-net': { enabled: false },
    },
    metricExportIntervalMillis: 5_000,
  },
});
forceDevExport
這個選項會在 dev 環境 (例如本機) 中執行時,強制 Genkit 匯出遙測資料和記錄資料。
取樣器
如果無法匯出所有追蹤記錄,OpenTelemetry 允許追蹤記錄取樣。
四種預先設定的取樣器如下:
- AlwaysOnSampler:擷取所有追蹤記錄的樣本
- AlwaysOffSampler:無追蹤記錄取樣
- ParentBased:根據父項時距的樣本
- TraceIdRatioBased:取樣追蹤記錄的百分比 (可設定)
autoInstrumentation 和 autoInstrumentationConfig
啟用自動檢測功能後,OpenTelemetry 就能擷取第三方程式庫中的遙測資料,而不需要修改程式碼。
指標匯出間隔
這個欄位會指定指標匯出間隔 (以毫秒為單位)。
測試整合
設定外掛程式時,請使用 forceDevExport: true 啟用本機執行的遙測匯出功能。這種做法能快速傳送第一項事件來進行 Google Cloud 監控。
透過 Google Cloud 作業套件監控實際運作環境
部署流程後,請前往 Google Cloud 作業套件並選取專案。

記錄檔和追蹤記錄
在側邊選單中找出「Logging」(記錄),然後按一下「Logs Explorer」(記錄瀏覽器)。

畫面會顯示與已部署流程相關聯的所有記錄,包括 console.log()。任何前置字串為 [genkit] 的記錄都是 Genkit-internal 記錄,當中包含可能用於偵錯的資訊。舉例來說,格式為 Config[...] 的 Genkit 記錄包含中繼資料,例如特定 LLM 推論的溫度和 topK 值。Output[...] 格式的記錄含有 LLM 回應,Input[...] 記錄則含有提示。Cloud Logging 擁有完善的 ACL,可讓您精細控管機密記錄檔。
如需查看特定記錄行,可以按一下擴充選單 ![]() 圖示並選取「在追蹤記錄詳細資料中查看」,前往個別追蹤記錄。
圖示並選取「在追蹤記錄詳細資料中查看」,前往個別追蹤記錄。

系統隨即顯示追蹤記錄預覽窗格,方便您快速查看追蹤記錄的詳細資料。如需完整詳細資料,請按一下「在 Trace 中查看」請點選窗格右上角的連結

Cloud Trace 中最醒目的導覽元素是追蹤記錄散佈圖。其中包含指定時間範圍內收集的所有追蹤記錄。

按一下每個資料點,散布圖下方就會顯示詳細資料。

詳細檢視畫面包含流程形狀 (包括所有步驟) 和重要時間資訊。Cloud Trace 可在這個檢視畫面中交錯顯示與特定追蹤記錄相關聯的所有記錄。選取 [顯示已展開的事件]即可活動"。

產生結果檢視畫面可讓您詳細檢查追蹤記錄中的記錄檔,包括提示和 LLM 回覆。

指標
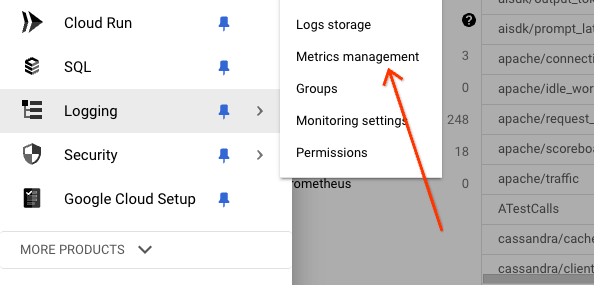
如要查看 Genkit 匯出的所有指標,請從側邊選單中選取「Logging」,然後按一下「Metrics management」。
指標管理主控台包含所有收集的指標表格檢視畫面,包括與 Cloud Run 及其周遭環境相關的指標。按一下「工作負載」畫面上就會顯示一份清單,其中包含 Genkit 收集的指標。凡是含有 genkit 字首的指標,都屬於內部 Genkit 指標。

Genkit 會收集多種指標,包括流程層級、動作層級和產生層級指標。每個指標都有幾個實用的維度,可協助您進行篩選和分組。
常見的維度包括:
flow_name:流程的頂層名稱。flow_path:跨度和其父項跨度會鏈結至根跨度。error_code:如果發生錯誤,則會顯示對應的錯誤代碼。error_message:如果發生錯誤,則顯示對應的錯誤訊息。model:模型的名稱。temperature- 推論溫度 value。topK- 推論的 TopK 值。topP- 推論 topP 值。
流程層級指標
| 名稱 | 維度 |
|---|---|
| genkit/流程/要求 | 流程名稱、error_code、error_message |
| genkit/flow/latency | flow_name |
動作層級指標
| 名稱 | 維度 |
|---|---|
| genkit/行動/要求 | flow_name、error_code、error_message |
| genkit/action/latency | flow_name |
產生層級指標
| 名稱 | 維度 |
|---|---|
| genkit/AI/生成 | 流量路徑、模型、隨機性參數、topK、topP、error_code、error_message |
| genkit/ai/generate/input_tokens | 流量路徑、模型、溫度、TopK、TopP |
| genkit/ai/generate/output_tokens | flow_path、model、temperature、topK、topP |
| genkit/ai/generate/input_characters | flow_path、model、temperature、topK、topP |
| genkit/ai/generate/output_characters | flow_path、model、temperature、topK、topP |
| genkit/ai/generate/input_images | 流量路徑、模型、溫度、TopK、TopP |
| genkit/ai/generate/output_images | flow_path、model、temperature、topK、topP |
| genkit/ai/生成/延遲 | 流量路徑、模型、隨機性參數、topK、topP、error_code、error_message |
您可以透過 Metrics Explorer 視覺化指標。在側邊選單中選取「記錄」並點選「Metrics Explorer」

按一下「選取指標」下拉式選單,選取「Generic Node」、「Genkit」和指標,即可選取指標。

指標的視覺化效果取決於指標類型 (計數器、直方圖等)。Metrics Explorer 提供強大的匯總和查詢工具,可根據各種維度繪製指標圖表。

遙測延遲
在 Cloud 的作業套件中顯示特定執行流程的遙測資料前,可能會稍微延遲。在大多數情況下,這項延遲時間會低於 1 分鐘。
配額與限制
請注意以下幾項重要配額:
- Cloud Trace 配額
- 每個屬性鍵 128 個位元組
- 每個屬性值 256 個位元組
- Cloud Logging 配額
- 每個記錄項目 256 KB
- Cloud Monitoring 配額
費用
Cloud Logging、Cloud Trace 和 Cloud Monitoring 提供免費方案。如要瞭解具體價格,請點選下列連結: