
Google Cloud 插件可将 Firebase Genkit 的遥测和日志记录数据导出到 Google Cloud 的运维套件。
安装
npm i --save @genkit-ai/google-cloud
如果要在本地运行使用此插件的流,还需要安装 Google Cloud CLI 工具。
设置 Google Cloud 账号
此插件需要 Google Cloud 帐号(如果您还没有 Google Cloud 帐号,请注册)和 Google Cloud 项目。
在添加该插件之前,请确保已为您的项目启用以下 API:
这些 API 应该会在项目的 API 信息中心中列出。
点击此处详细了解如何启用和停用 API。
Genkit 配置
如需启用导出到 Google Cloud Tracing、Logging 和 Monitoring,请将 googleCloud 插件添加到您的 Genkit 配置:
import { googleCloud } from '@genkit-ai/google-cloud';

export default configureGenkit({
  plugins: [googleCloud()],
  enableTracingAndMetrics: true,
  telemetry: {
    instrumentation: 'googleCloud',
    logger: 'googleCloud',
  },
});
在生产环境中运行时,您的遥测数据会自动导出。
该插件需要 Google Cloud 项目 ID 和您的 Google Cloud 项目凭据。如果您从 Google Cloud 环境(Cloud Functions、Cloud Run 等)运行流,系统会自动设置项目 ID 和凭据。如需在其他环境中运行,需要将 GCLOUD_PROJECT 环境变量设置为您的 Google Cloud 项目,并使用 gcloud 工具进行身份验证:
gcloud auth application-default login
如需了解详情,请参阅应用默认凭据文档。
插件配置
googleCloud() 插件可接受可选的配置对象:
{
    projectId?: string,
    telemetryConfig?: TelemetryConfig
}
projectId
此选项允许明确指定 Google Cloud 项目 ID。在大多数情况下,这是没有必要的。
遥测配置
此选项用于配置 OpenTelemetry NodeSDK 实例。
import { AlwaysOnSampler } from '@opentelemetry/sdk-trace-base';

googleCloud({
  telemetryConfig: {
    forceDevExport: false, // Set this to true to export telemetry for local runs
    sampler: new AlwaysOnSampler(),
    autoInstrumentation: true,
    autoInstrumentationConfig: {
      '@opentelemetry/instrumentation-fs': { enabled: false },
      '@opentelemetry/instrumentation-dns': { enabled: false },
      '@opentelemetry/instrumentation-net': { enabled: false },
    },
    metricExportIntervalMillis: 5_000,
  },
});
forceDevExport
选择此选项后,Genkit 在 dev 环境(例如本地)中运行时会导出遥测数据和日志数据。
采样器
如果无法导出所有跟踪记录,OpenTelemetry 允许对跟踪记录进行采样。
有四个预配置的采样器:
- AlwaysOnSampler - 对所有跟踪记录进行采样
- AlwaysOffSampler - 不对跟踪记录进行采样
- ParentBased - 基于父级 span 的样本
- TraceIdRatioBased - 对可配置的跟踪记录百分比进行采样
autoInstrumentation 和 autoInstrumentationConfig
启用自动插桩后,OpenTelemetry 可以从第三方库捕获遥测数据,而无需修改代码。
MetricsExportInterval
此字段用于指定指标导出间隔(以毫秒为单位)。
测试您的集成
配置插件时,请使用 forceDevExport: true 为本地运行启用遥测数据导出。这是一种在 Google Cloud 中快速发送您的第一批事件以进行监控的方法。
通过 Google Cloud 的运维套件对生产进行监控
部署流后,导航到 Google Cloud 的运维套件并选择您的项目。
日志和跟踪记录
在侧边菜单中,找到“Logging”,然后点击“日志浏览器”。

您将看到与您部署的流程关联的所有日志,包括 console.log()。任何以 [genkit] 为前缀的日志都是 Genkit 内部日志,其中包含了可能需要用于调试的信息。例如,Config[...] 格式的 Genkit 日志包含特定 LLM 推断的温度和 topK 值等元数据。Output[...] 格式的日志包含 LLM 响应,而 Input[...] 日志包含提示。Cloud Logging 具有强大的 ACL,可用于对敏感日志进行精细控制。
对于特定日志行,可以点击展开的菜单图标 ![]() 并选择“View in trace details”(在跟踪记录详情中查看),导航到各自的跟踪记录。
并选择“View in trace details”(在跟踪记录详情中查看),导航到各自的跟踪记录。

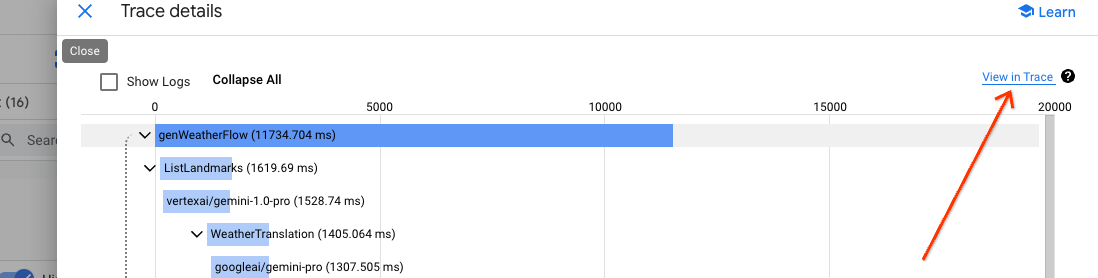
系统随即会打开一个跟踪数据预览窗格,供您快速浏览跟踪数据的详细信息。如需获取完整详情,请点击窗格右上角的“在 Trace 中查看”链接。
Cloud Trace 中最显著的导航元素是轨迹散点图。它包含给定时间范围内收集的所有跟踪记录。
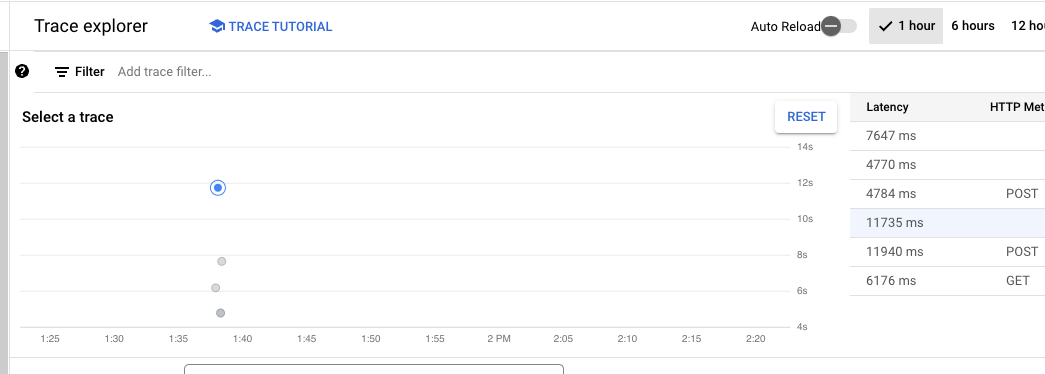
点击每个数据点即可在散点图下方显示其详细信息。
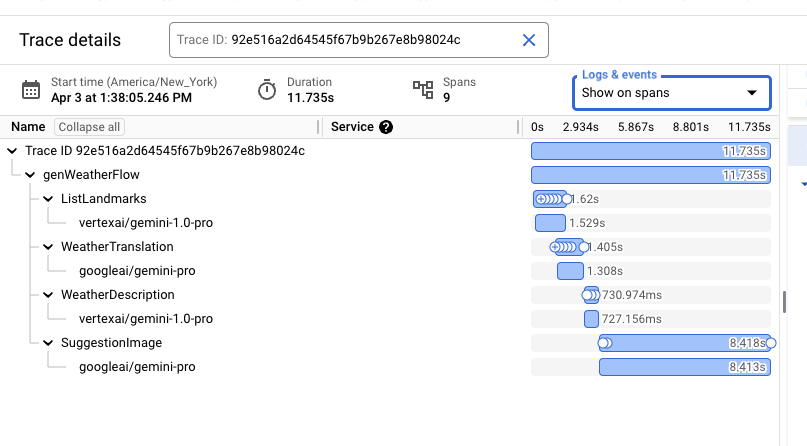
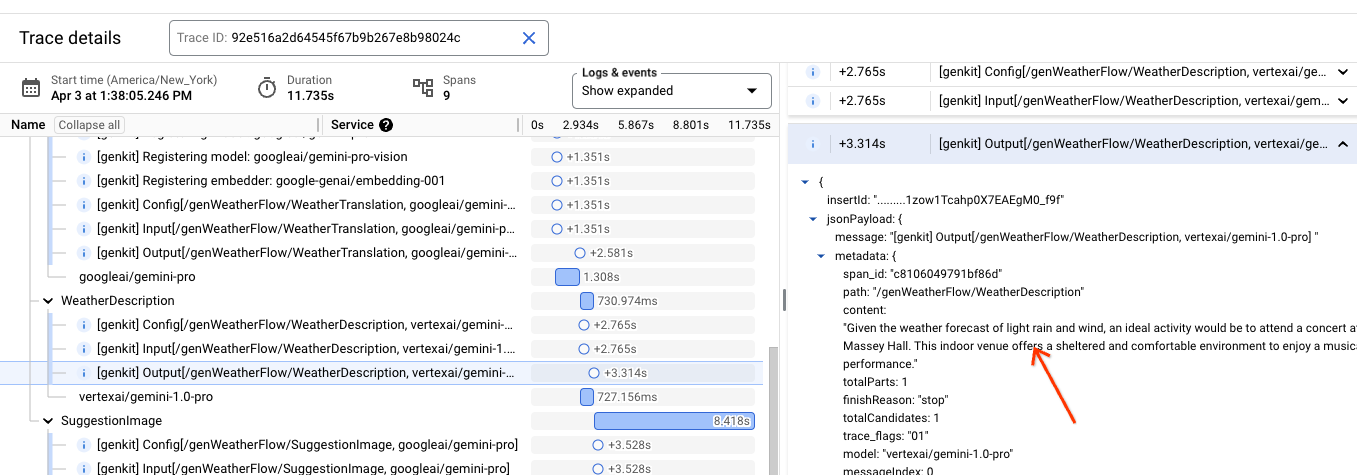
详细视图包含流程形状,其中包括所有步骤和重要的耗时信息。Cloud Trace 能够在此视图中交错与给定跟踪记录关联的所有日志。在“日志与事件”下拉菜单中选择“显示展开内容”选项。

由此生成视图,让您可以详细检查跟踪记录上下文中的日志,包括提示和 LLM 响应。
指标
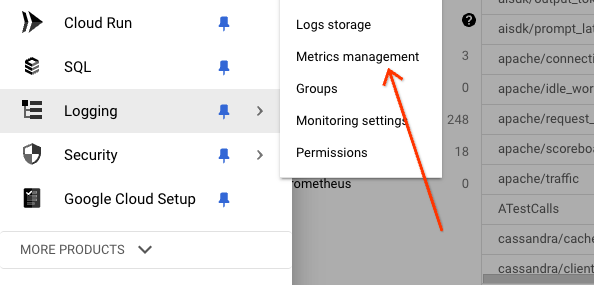
如需查看 Genkit 导出的所有指标,请从侧边菜单中选择“日志记录”,然后点击“指标管理”。
指标管理控制台包含一个表格视图,其中包含所有收集的指标,包括与 Cloud Run 及其周围环境相关的指标。点击“工作负载”选项后,系统会显示一个包含 Genkit 收集的指标的列表。任何带有 genkit 前缀的指标都是内部 Genkit 指标。
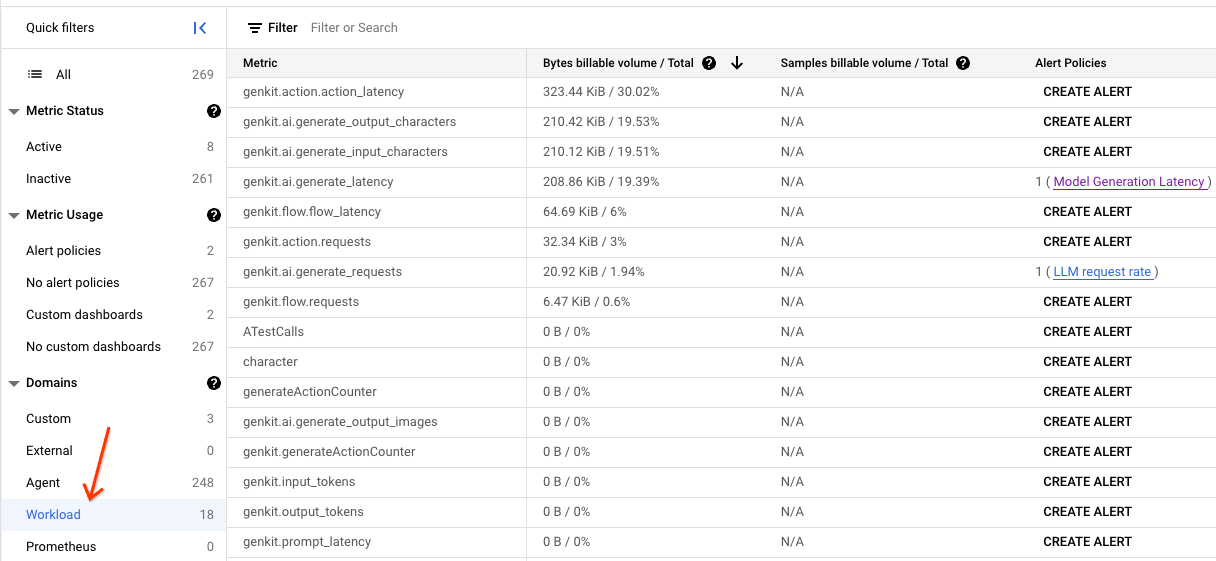
Genkit 会收集多类指标,包括流级指标、操作级指标和生成级指标。每个指标都具有多个实用的维度,以便实现稳健的过滤和分组。
常见的维度包括:
flow_name- 流的顶级名称。flow_path- span 及其父级 span 链,直到根 span。error_code- 如果出现错误,则为相应的错误代码。error_message- 如果出现错误,则显示相应的错误消息。model- 模型的名称。temperature- 推理温度值。topK- 推断 topK 值。topP- 推断 TopP 值。
流级指标
| 名称 | 维度 |
|---|---|
| genkit/flow/requests | flow_name、error_code、error_message |
| Genkit/flow/latency | 流名称 |
操作级指标
| 名称 | 维度 |
|---|---|
| genkit/action/requests | flow_name、error_code、error_message |
| Genkit/action/latency | 流名称 |
生成级指标
| 名称 | 维度 |
|---|---|
| genkit/ai/generate | flow_path、model、 temperature、topK、topP、error_code、error_message |
| genkit/ai/generate/input_tokens | flow_path、model、 temperature、topK、topP |
| genkit/ai/generate/output_tokens | flow_path、model、 temperature、topK、topP |
| genkit/ai/generate/input_characters | flow_path、model、 temperature、topK、topP |
| genkit/ai/generate/output_characters | flow_path、model、 temperature、topK、topP |
| genkit/ai/generate/input_images | flow_path、model、 temperature、topK、topP |
| genkit/ai/generate/output_images | flow_path、model、 temperature、topK、topP |
| genkit/ai/generate/latency | flow_path、model、 temperature、topK、topP、error_code、error_message |
您可以通过 Metrics Explorer 直观呈现指标。使用侧边菜单,选择“Logging”,然后点击“Metrics Explorer”
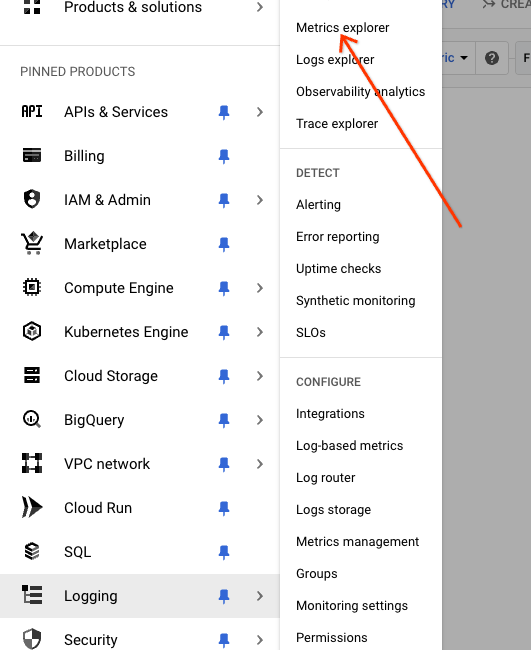
点击“选择指标”下拉菜单,选择“通用节点”“Genkit”和一项指标,以选择指标。
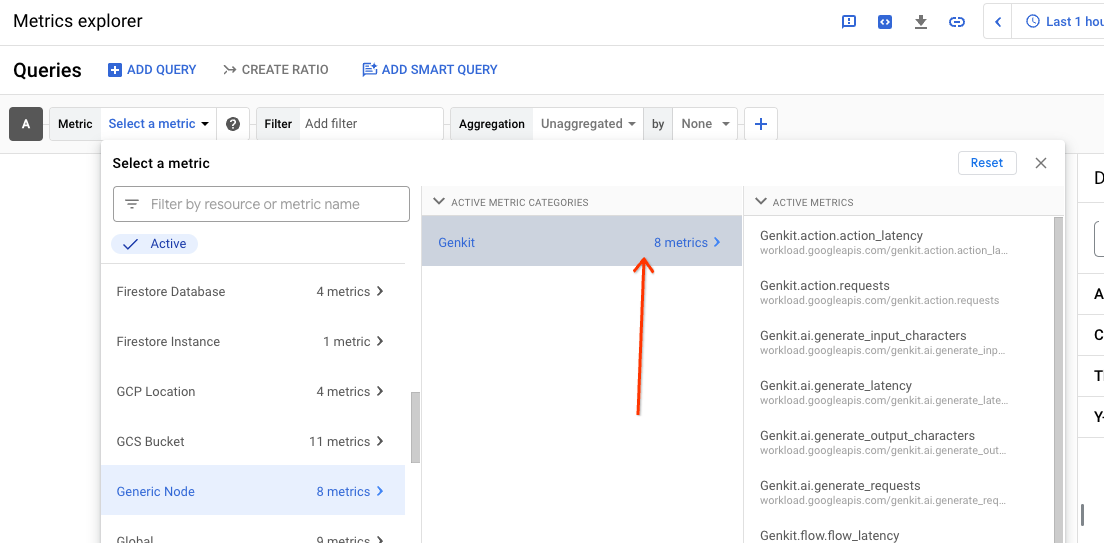
指标的直观显示方式取决于指标的类型(计数器、直方图等)。Metrics Explorer 提供强大的汇总和查询工具,有助于按各种维度用图表显示指标。

遥测延迟
流的特定执行的遥测数据可能略有延迟才会显示在 Cloud 的运维套件中。在大多数情况下,此延迟不到 1 分钟。
配额和限制
请务必注意以下几个配额:
- Cloud Trace 配额
- 每个属性键 128 个字节
- 每个属性值 256 个字节
- Cloud Logging 配额
- 每个日志条目 256 KB
- Cloud Monitoring 配额
费用
Cloud Logging、Cloud Trace 和 Cloud Monitoring 提供宽裕的免费层级。要查看具体价格,请访问以下链接: