
با Performance Monitoring ، میتوانید از ویژگیها برای تقسیمبندی دادههای عملکرد استفاده کنید و بر عملکرد برنامه خود در سناریوهای مختلف دنیای واقعی تمرکز کنید.
پس از کلیک روی نام یک ردیابی در جدول ردیابیها (واقع در پایین داشبورد عملکرد )، میتوانید معیارهای مورد علاقه خود را بررسی کنید. از
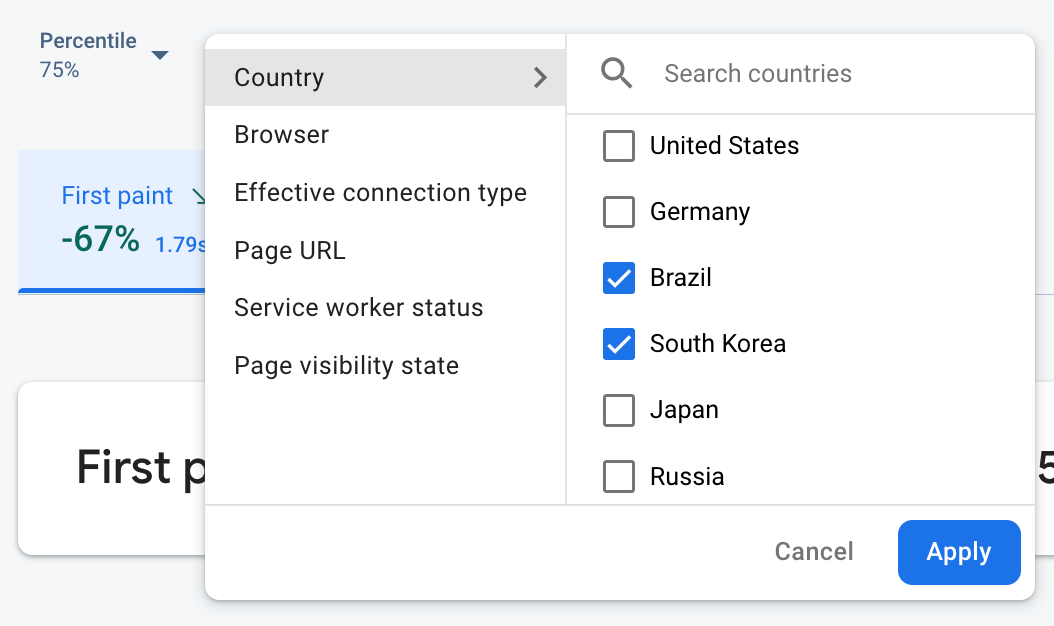 دادههای نظارت بر عملکرد Firebase بر اساس ویژگی فیلتر میشوند" />
- برای مشاهده دادههای یک صفحه خاص از سایت خود، بر اساس URL صفحه فیلتر کنید
- برای اطلاع از چگونگی تأثیر اتصال 3G بر برنامه شما، آن را بر اساس نوع اتصال مؤثر فیلتر کنید
- بر اساس کشور فیلتر کنید تا مطمئن شوید موقعیت مکانی پایگاه داده شما بر منطقه خاصی تأثیر نمیگذارد
ویژگیهای پیشفرض
Performance Monitoring بسته به نوع ردیابی، به طور خودکار مجموعهای از ویژگیهای پیشفرض را جمعآوری میکند.
علاوه بر این ویژگیهای پیشفرض، میتوانید ویژگیهای سفارشی نیز روی ردیابیهای کد سفارشی خود ایجاد کنید تا دادهها را بر اساس دستهبندیهای خاص برنامه خود بخشبندی کنید. به عنوان مثال، در یک بازی، میتوانید دادهها را بر اساس سطح بازی بخشبندی کنید.
ویژگیهای پیشفرض جمعآوریشده برای برنامههای وب
همه ردپاها برای برنامههای وب به طور پیشفرض ویژگیهای زیر را جمعآوری میکنند:
- مرورگر
- کشور
- نوع اتصال موثر
- آدرس صفحه
- وضعیت کارگر خدماتی
- وضعیت دید
جمعآوری دادههای کاربر
ایجاد ویژگیهای سفارشی
شما میتوانید روی هر یک از ردپاهای کد سفارشیِ ابزاربندیشدهی خود، ویژگیهای سفارشی ایجاد کنید.
از API ردیابی Performance Monitoring برای افزودن ویژگیهای سفارشی به ردیابیهای کد سفارشی استفاده کنید.
برای استفاده از ویژگیهای سفارشی، کدی را به برنامه خود اضافه کنید که ویژگی را تعریف میکند و آن را با یک ردیابی کد سفارشی خاص مرتبط میکند. میتوانید ویژگی سفارشی را در هر زمانی بین شروع ردیابی و پایان ردیابی تنظیم کنید.
به موارد زیر توجه کنید:
نامهای مربوط به ویژگیهای سفارشی باید شرایط زیر را داشته باشند:
- بدون فاصلهی خالی در ابتدا یا انتهای کاراکتر، بدون کاراکتر زیرخط (
_) در ابتدای کاراکتر - بدون فاصله
- حداکثر طول ۳۲ کاراکتر است
- کاراکترهای مجاز برای نام عبارتند از
AZ،azو_.
- بدون فاصلهی خالی در ابتدا یا انتهای کاراکتر، بدون کاراکتر زیرخط (
هر ردیابی کد سفارشی میتواند تا ۵ ویژگی سفارشی را ثبت کند.
لطفاً مطمئن شوید که ویژگیهای سفارشی حاوی هیچ اطلاعاتی نیستند که هویت شخصی را برای گوگل مشخص کند.
درباره این دستورالعمل بیشتر بدانید
Web
import { trace } from "firebase/performance"; const t = trace(perf, "test_trace"); t.putAttribute("experiment", "A"); // Update scenario t.putAttribute("experiment", "B"); // Reading scenario const experimentValue = t.getAttribute("experiment"); // Delete scenario t.removeAttribute("experiment"); // Read attributes const traceAttributes = t.getAttributes();
Web
const trace = perf.trace("test_trace"); trace.putAttribute("experiment", "A"); // Update scenario trace.putAttribute("experiment", "B"); // Reading scenario const experimentValue = trace.getAttribute("experiment"); // Delete scenario trace.removeAttribute("experiment"); // Read attributes const traceAttributes = trace.getAttributes();