
Performance Monitoring 使用跟踪记录来收集有关应用中受监控进程的数据。跟踪记录是一种报告,包含两个时间点之间在应用中捕获的数据。
对于 Apple 和 Android 应用,Performance Monitoring 会自动收集与应用生命周期相关的多个跟踪记录。所有这些跟踪记录都类似于计时器,因为它们会衡量进程运行所需的时间(“时长”)。
应用启动跟踪记录 - 此跟踪记录衡量用户打开应用到应用响应之间的时间
应用前台活动跟踪记录 - 此跟踪记录衡量应用在前台运行且可供用户使用的时间
应用后台跟踪记录 - 此跟踪记录衡量应用在后台运行的时间
由于这些跟踪记录仅收集“时长”指标,因此它们有时被称为“时长跟踪记录”。
您可以在“性能”信息中心底部的跟踪记录表的“自定义跟踪记录”子标签页中查看这些跟踪记录的数据(在本页下文中详细了解如何使用控制台)。
每个跟踪记录的定义
Performance Monitoring 在应用中利用方法调用和通知来确定每种类型的跟踪记录何时开始和停止。所有这些跟踪记录都类似于计时器,因为它们会衡量进程运行所需的时间。
应用启动跟踪记录
此跟踪记录衡量用户打开应用到应用响应之间的时间。在控制台中,此跟踪记录的名称为 _app_start。此跟踪记录收集的指标为“时长”。
在应用将第一个
Object加载到内存时启动。在应用收到
UIApplicationDidBecomeActiveNotification通知后发生第一次成功运行循环后停止。
应用前台活动跟踪记录
此跟踪记录衡量应用在前台运行且可供用户使用的时间。在控制台中,此跟踪记录的名称为 _app_in_foreground。此跟踪记录收集的指标为“时长”。
应用收到
UIApplicationDidBecomeActiveNotification通知时启动。应用收到
UIApplicationWillResignActiveNotification通知时停止。
应用后台活动跟踪记录
此跟踪记录衡量应用在后台运行的时间。在控制台中,此跟踪记录的名称为 _app_in_background。此跟踪记录报告的指标为“时长”。
应用收到
UIApplicationWillResignActiveNotification通知时启动。应用收到
UIApplicationDidBecomeActiveNotification通知时停止。
这些跟踪记录收集的指标
这些跟踪记录属于开箱即用的跟踪记录,因此您无法向其中添加自定义指标或自定义特性。
所有这些跟踪记录都类似于计时器,因为它们会衡量受监控的进程运行所需的时间。此收集的指标的名称为“时长”。
跟踪、查看和过滤性能数据
如需查看实时性能数据,请确保您的应用使用与实时数据处理功能兼容的 Performance Monitoring SDK 版本。详细了解实时性能数据。
在信息中心内跟踪关键指标
如需了解关键指标的趋势如何,请将这些指标添加到“性能”信息中心顶部的指标板中。您可以通过查看逐周变化情况来快速识别回归问题,或者确认近期的代码更改是否正在改善性能。
 Firebase Performance Monitoring 信息中心" /> 内的指标板的图像
如需将指标添加到指标板,请按以下步骤操作:
- 前往 Firebase 控制台中的“性能”信息中心。
- 点击空白指标卡片,然后选择要添加到指标板的现有指标。
- 在填充了信息的指标卡片上点击 可查看更多选项,例如替换或移除指标。
该指标板以图表形式以及数值百分比变化的形式显示一段时间内收集的指标数据。
详细了解如何使用信息中心。
查看跟踪记录及其数据
如需查看您的跟踪记录,请前往 Firebase 控制台中的“性能”信息中心,向下滚动到跟踪记录表,然后点击相应的子标签页。该表会针对每个跟踪记录显示一些热门指标,您甚至可以按特定指标的百分比变化对该列表进行排序。
Performance Monitoring 在 Firebase 控制台中提供了一个问题排查页面,其中会突出显示指标变化,以便您轻松快速地解决性能问题并最大限度地降低对应用和用户的影响。在了解到可能存在性能问题时(例如在以下情况下),您可以使用该问题排查页面:
- 您在信息中心选择了相关指标,并注意到较大的增量。
- 在跟踪记录表中,您通过排序在顶部显示最大的增量,并且看到显著的百分比变化。
- 您收到一条向您通知性能问题的电子邮件提醒。
您可以通过以下方式访问该问题排查页面:
- 在指标信息中心内,点击查看指标详情按钮。
- 在任意指标卡片上,选择
=> 查看详情 。该问题排查页面会显示有关所选指标的信息。 - 在跟踪记录表中,点击跟踪记录名称或与该跟踪记录关联的行中的任意指标值。
- 在电子邮件提醒中,点击立即调查。
点击跟踪记录表中的跟踪记录名称后,您可以深入了解感兴趣的指标。点击
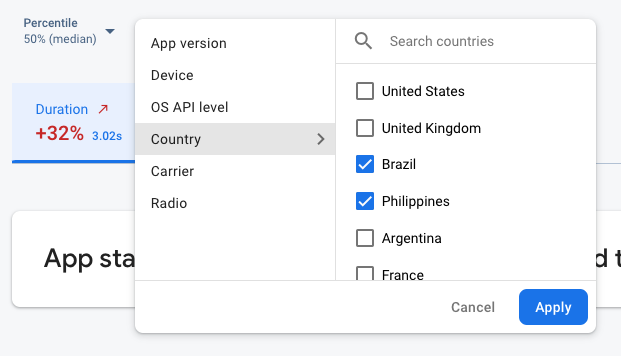 按属性过滤 Firebase Performance Monitoring 数据" /> 的图片
- 按“应用版本”过滤可查看有关过去版本或最新版本的数据
- 按“设备”过滤可了解旧设备处理应用的方式
- 按“国家/地区”过滤可确保您的数据库位置不会影响特定区域
详细了解如何查看跟踪记录的数据。
后续步骤
详细了解如何使用属性来检查性能数据。
详细了解如何在 Firebase 控制台中跟踪性能问题。
针对会降低应用性能的代码更改设置提醒。例如,当应用启动时间超出您设置的阈值时,您可以为团队配置电子邮件提醒。
- 查看用户会话的详细报告,通过该报告您可以在同一个会话期间收集的其他跟踪记录的时间轴上下文中查看特定跟踪记录。