使用 DebugView,您能够以近乎实时的方式查看由开发设备上的应用记录的原始事件数据。这在开发的插桩阶段进行验证时很有用,可帮助您发现 Analytics 实现中的错误,还可以帮您确认所有事件和用户属性已正确记录。
启用调试模式
通常,您的应用所记录的事件会每隔 1 小时左右集中起来作为一批进行处理,并一起上传。此方法能节省最终用户的设备电量和网络流量。但是,为了验证您的 Analytics 实现情况(也是为了能在 DebugView 报告中查看您的 Analytics 信息),您可以在开发设备上启用调试模式,从而以最短的延迟上传事件。
iOS+
如需在开发设备上启用 Analytics 调试模式,请在 Xcode 中指定以下命令行参数:
-FIRDebugEnabled
调试模式将保持启用状态,直至您通过指定以下命令行参数明确将其停用:
-FIRDebugDisabled
如需添加这些参数,请修改项目的 Scheme,并将新条目添加到“Arguments Passed On Launch”(启动参数)中。
Android
如需在 Android 设备上启用 Analytics 调试模式,请执行以下命令:
adb shell setprop debug.firebase.analytics.app PACKAGE_NAME
调试模式将保持启用状态,直至您通过执行以下命令明确将其停用:
adb shell setprop debug.firebase.analytics.app .none.
Web
如需在浏览器中启用 Analytics 调试模式,请安装 Google Analytics Debugger Chrome 扩展程序。
安装此扩展程序后,将其启用并刷新页面。从该时间点开始,此扩展程序将以调试模式记录应用中的事件。
您可以在 Firebase 控制台中查看在 DebugView 中记录的事件。
有关事件数据的报告
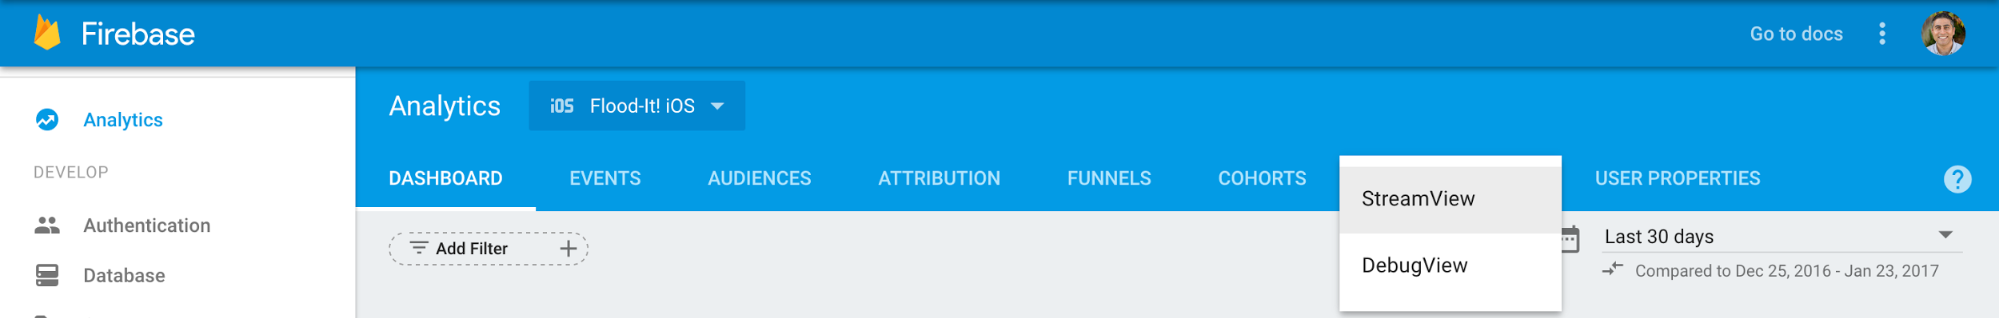
在开发设备上启用调试模式之后,请前往 DebugView,具体方法是选择 Google Analytics 顶部导航栏上的 StreamView 旁边的箭头,然后选择“DebugView”。
 "> Google Analytics 顶部导航栏上的 StreamView 旁边的箭头,然后选择“DebugView”
然后,只需开始使用您的应用,即可看到该应用的事件记录在 DebugView 报告中。
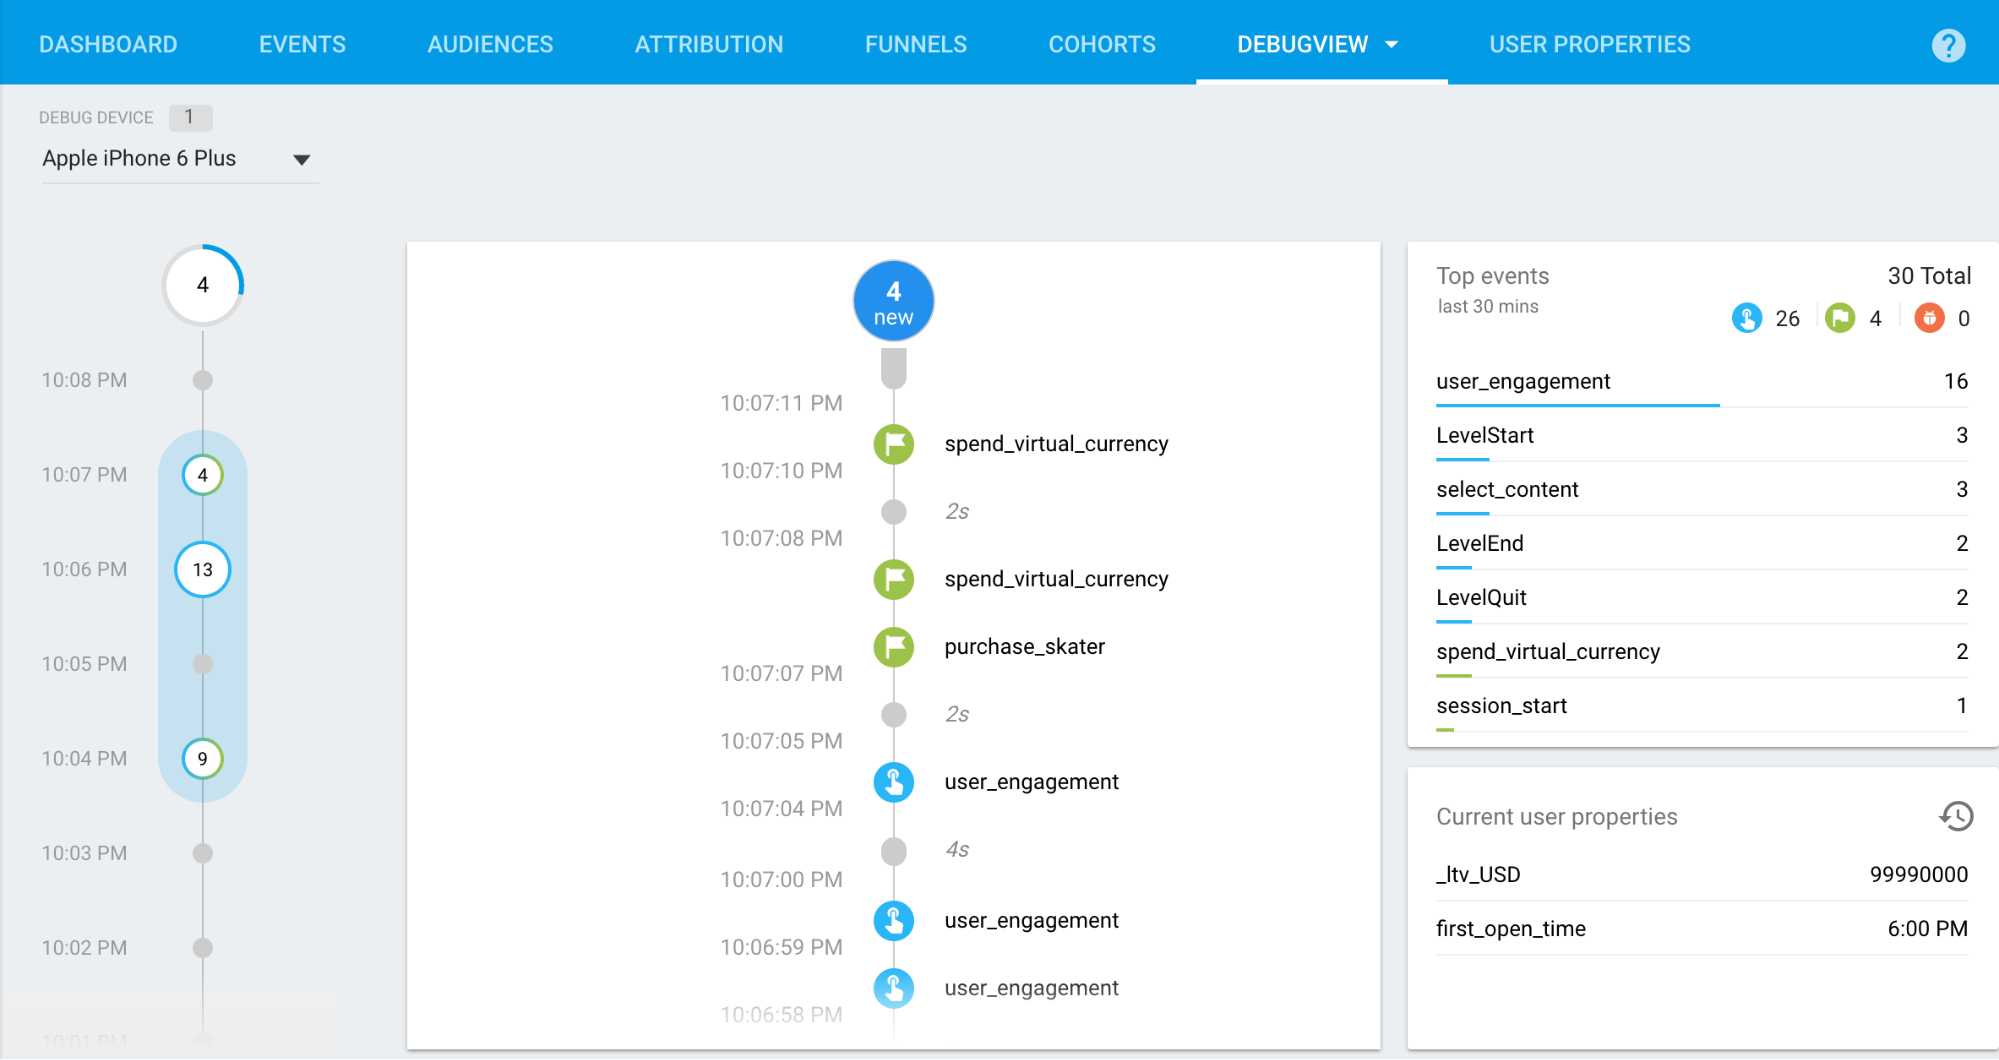
“秒”信息流(中间列)显示的是过去 60 秒内记录的事件。“分钟”信息流(左侧列)显示的是过去 30 分钟内的事件的汇总。而右侧列显示的是 30 分钟内记录的热点事件,以及当前所选开发设备的当前用户属性。
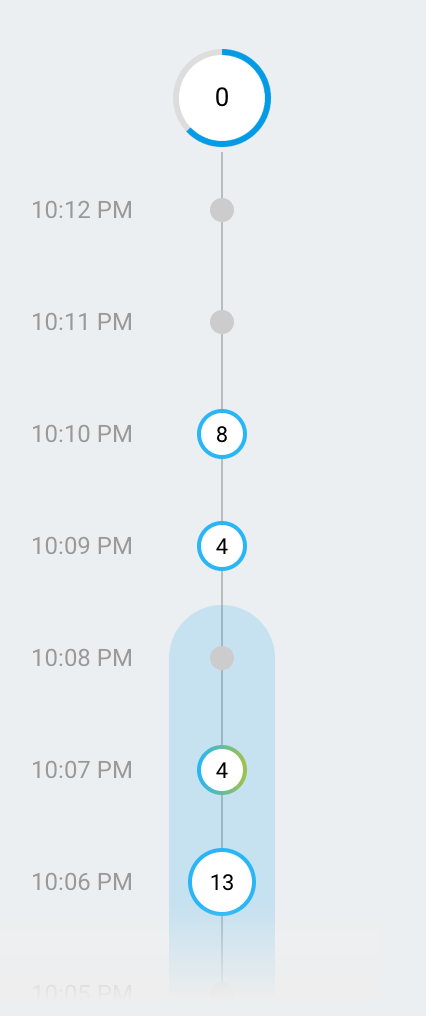
秒流
默认情况下,您将看到过去 60 秒内记录的事件的列表。每个事件都会显示与其在开发设备上的记录时间相对应的时间戳。您可以点击事件来查看与其关联的参数的列表。
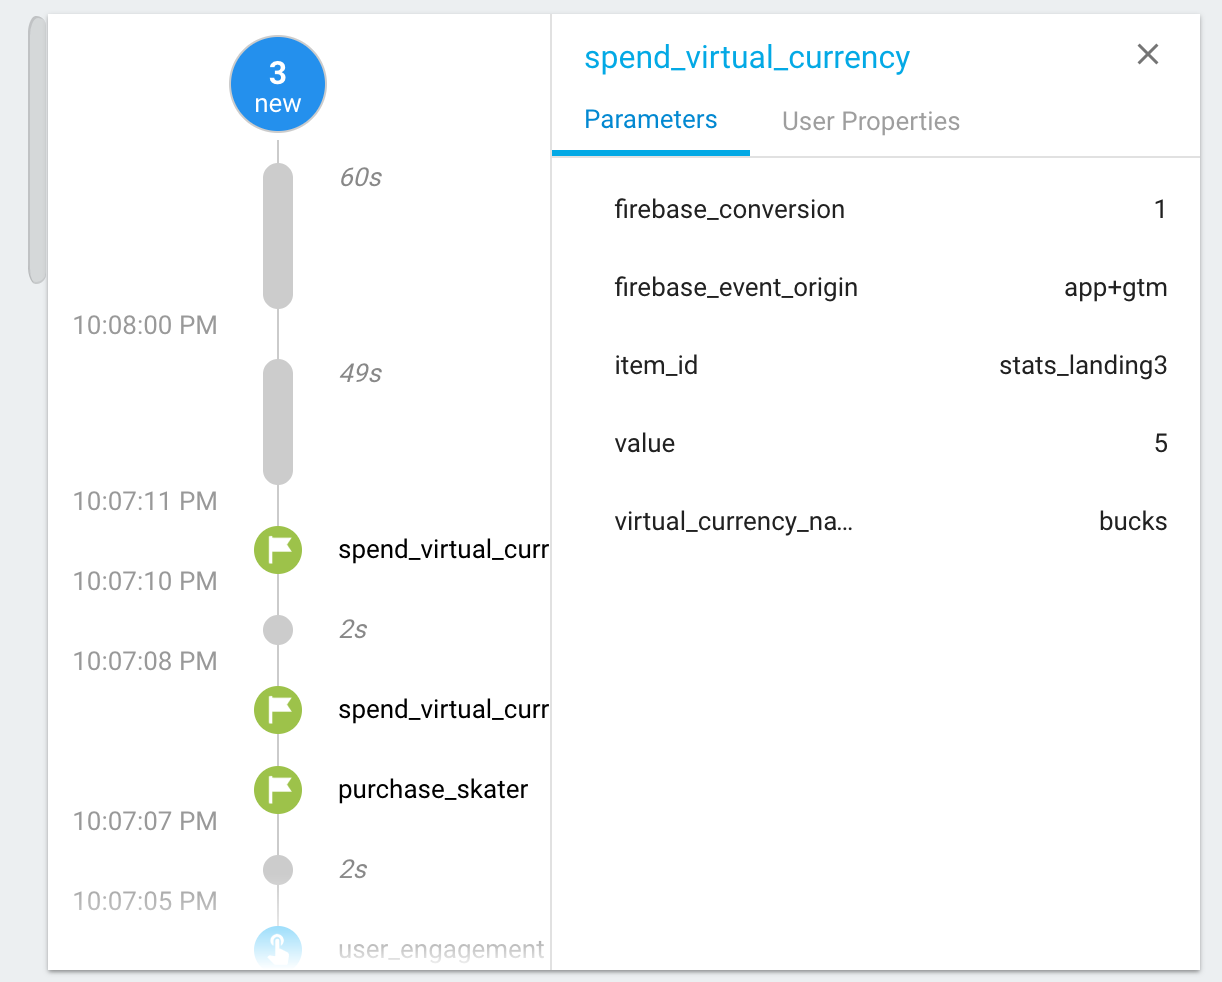
随着用户属性值在应用使用过程中发生变化,您将看到对应于该变化的一个事件条目。

分钟流
此信息流会显示一系列圆圈,一个圆圈对应着过去 30 分钟内的一分钟。圆圈内的数字代表在相应分钟内收到的事件数。点击其中一个圆圈会将在该分钟内记录的事件填充到“秒”信息流中。 这有助于您更详细地查看过去 30 分钟内记录的事件。
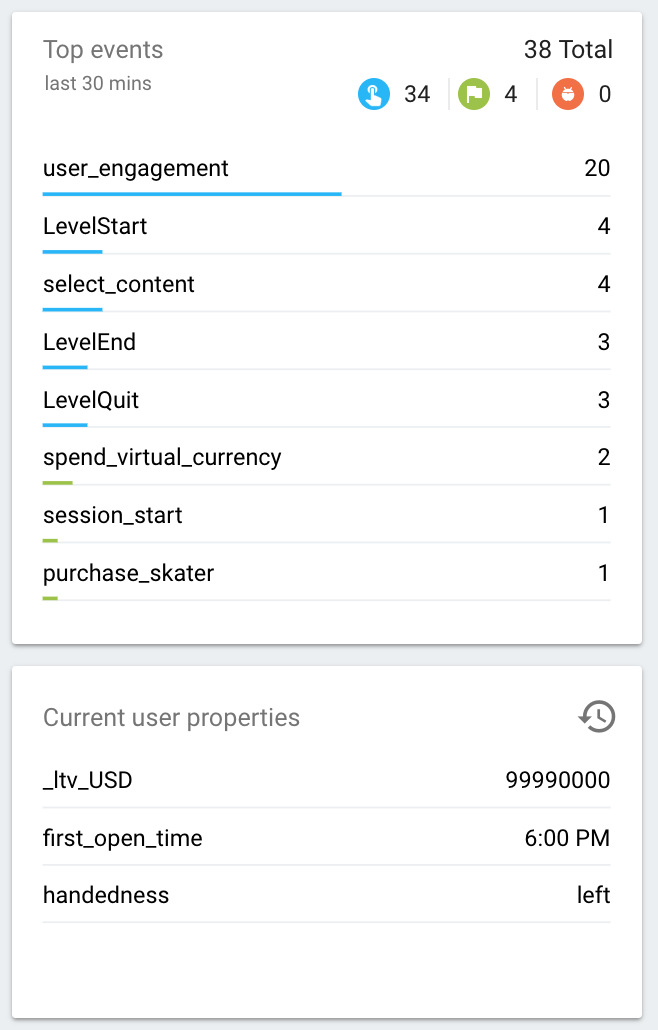
“热门事件”和“当前用户属性”
“热点事件”表显示 30 分钟内记录的热点事件。“当前用户属性”表显示当前选择的开发设备的各种用户属性的最新状态。
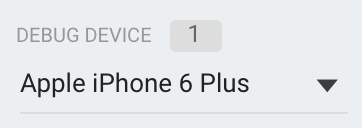
设备选择器
由于您可以为许多不同的开发设备启用调试模式,因此可使用设备选择器来选择想要 DebugView 报告关注的特定设备。这样多名开发者可以专注于各自的插桩 (Instrumentation) 测试和验证工作,而不会相互影响。