
Performance Monitoring 會收集追蹤記錄,協助您監控應用程式的效能。追蹤記錄是應用程式在兩個時間點之間擷取的效能資料報告。
您可以建立自己的追蹤記錄,監控應用程式中特定程式碼的相關效能資料。透過自訂程式碼追蹤記錄,您可以測量應用程式完成特定工作或一組工作所需的時間,例如載入一組圖片或查詢資料庫。
自訂程式碼追蹤記錄的預設指標是「持續時間」(追蹤記錄的開始和停止點之間的時間),但您也可以新增自訂指標。
在程式碼中,您可以使用 Performance Monitoring SDK 提供的 API,定義自訂程式碼追蹤的開始和結束位置。
如果是 Android 應用程式,您也可以使用 @AddTrace 註解監控特定方法。
自訂程式碼追蹤記錄建立後,隨時可以啟動,且具有執行緒安全性。
由於這些追蹤記錄預設收集的指標是「持續時間」,因此有時也稱為「持續時間追蹤記錄」。
您可以在「Performance」(效能) 資訊主頁底部的追蹤記錄表格中,查看這些追蹤記錄的資料。如要瞭解詳情,請參閱本頁稍後的主控台使用說明。
預設屬性、自訂屬性和自訂指標
如果是自訂程式碼追蹤記錄,Performance Monitoring 會自動記錄預設屬性 (常見中繼資料,例如應用程式版本、國家/地區、裝置等),方便您在 Firebase 控制台中篩選追蹤記錄的資料。您也可以新增及監控自訂屬性 (例如遊戲等級或使用者屬性)。您也可以進一步設定自訂程式碼追蹤,記錄追蹤範圍內發生的效能相關事件的自訂指標。舉例來說,您可以建立自訂指標,追蹤快取命中和未命中次數,或是 UI 顯著無回應的次數。
自訂屬性和自訂指標會與追蹤記錄的預設屬性和預設指標一起顯示在 Firebase 控制台中。
新增自訂程式碼追蹤記錄
使用 Performance Monitoring Trace API 新增自訂程式碼追蹤記錄,監控特定應用程式程式碼。
注意事項:
- 一個應用程式可以有多個自訂程式碼追蹤記錄。
- 您可以同時執行多個自訂程式碼追蹤。
- 自訂程式碼追蹤記錄的名稱必須符合下列規定:開頭或結尾不得有空白字元,開頭不得有底線 (
_) 字元,長度上限為 100 個字元。 - 自訂程式碼追蹤記錄支援新增自訂指標和自訂屬性。
如要啟動及停止自訂程式碼追蹤,請使用類似下列的程式碼行,包裝要追蹤的程式碼 (這個範例使用 test_trace 的自訂追蹤名稱):
Kotlin
// Import these Performance Monitoring classes at the top of your `.kt` file import com.google.firebase.perf.FirebasePerformance; import com.google.firebase.perf.metrics.Trace; val myTrace = Firebase.performance.newTrace("test_trace") myTrace.start() // code that you want to trace myTrace.stop()
Java
// Import these Performance Monitoring classes at the top of your `.java` file import com.google.firebase.perf.FirebasePerformance; import com.google.firebase.perf.metrics.Trace; Trace myTrace = FirebasePerformance.getInstance().newTrace("test_trace"); myTrace.start(); // code that you want to trace myTrace.stop();
(選用) 使用 @AddTrace 監控特定方法
Android 應用程式也支援 @AddTrace 註解,可檢測自訂程式碼追蹤記錄。使用這項功能時,追蹤作業會從指定方法開頭開始,並在方法完成時停止,包括方法叫用的任何項目。
舉例來說,您可以建立名為 onCreateTrace 的自訂程式碼追蹤記錄,在呼叫 onCreate() 方法時執行。
Kotlin
// Import these Performance Monitoring classes at the top of your `.kt` file import com.google.firebase.perf.FirebasePerformance; import com.google.firebase.perf.metrics.AddTrace; // Add the `@AddTrace` annotation above the method you want to trace // the `enabled` argument is optional and defaults to true @AddTrace(name = "onCreateTrace", enabled = true) override fun onCreate(savedInstanceState: Bundle?) { super.onCreate(savedInstanceState) }
Java
// Import these Performance Monitoring classes at the top of your `.java` file import com.google.firebase.perf.FirebasePerformance; import com.google.firebase.perf.metrics.AddTrace; // Add the `@AddTrace` annotation above the method you want to trace @Override @AddTrace(name = "onCreateTrace", enabled = true /* optional */) protected void onCreate(Bundle savedInstanceState) { super.onCreate(savedInstanceState); }
在自訂程式碼追蹤記錄中新增自訂指標
使用 Performance Monitoring Trace API ,將自訂指標新增至自訂程式碼追蹤記錄。
注意事項:
- 自訂指標名稱必須符合下列規定:
開頭或結尾不得有空白字元,開頭不得有底線 (
_) 字元, 且長度上限為 100 個字元。 - 每項自訂程式碼追蹤記錄最多可記錄 32 項指標 (包括預設的「時間長度」指標)。
如要新增自訂指標,請在每次發生事件時加入類似下列的程式碼行。舉例來說,這個自訂指標會計算應用程式中發生的效能相關事件,例如快取命中和未命中 (使用 item_cache_hit 和 item_cache_miss 的範例事件名稱,以及 1 的增量)。
Kotlin
val myTrace = Firebase.performance.newTrace("test_trace") myTrace.start() // code that you want to trace (and log custom metrics) val item = cache.fetch("item") if (item != null) { myTrace.incrementMetric("item_cache_hit", 1) } else { myTrace.incrementMetric("item_cache_miss", 1) } myTrace.stop()
Java
Trace myTrace = FirebasePerformance.getInstance().newTrace("test_trace"); myTrace.start(); // code that you want to trace (and log custom metrics) Item item = cache.fetch("item"); if (item != null) { myTrace.incrementMetric("item_cache_hit", 1); } else { myTrace.incrementMetric("item_cache_miss", 1); } myTrace.stop();
為自訂程式碼追蹤記錄建立自訂屬性
使用 Performance Monitoring Trace API ,將自訂屬性新增至自訂程式碼追蹤記錄。如要使用自訂屬性,請在應用程式中加入程式碼,定義屬性並將其與特定自訂程式碼追蹤記錄建立關聯。您可以在追蹤記錄開始和停止之間的任何時間設定自訂屬性。
注意事項:
自訂屬性的名稱必須符合下列規定:
- 開頭或結尾不得為空白字元,開頭不得為底線 (
_) 字元 - 沒有工作區
- 長度上限為 32 個半形字元
- 名稱可用的字元為
A-Z、a-z和_。
- 開頭或結尾不得為空白字元,開頭不得為底線 (
每個自訂程式碼追蹤記錄最多可記錄 5 個自訂屬性。
請確保自訂屬性不含任何可向 Google 識別個人身分的資訊。
進一步瞭解這項規範
Kotlin
Firebase.performance.newTrace("test_trace").trace { // Update scenario. putAttribute("experiment", "A") // Reading scenario. val experimentValue = getAttribute("experiment") // Delete scenario. removeAttribute("experiment") // Read attributes. val traceAttributes = this.attributes }
Java
Trace trace = FirebasePerformance.getInstance().newTrace("test_trace"); // Update scenario. trace.putAttribute("experiment", "A"); // Reading scenario. String experimentValue = trace.getAttribute("experiment"); // Delete scenario. trace.removeAttribute("experiment"); // Read attributes. Map<String, String> traceAttributes = trace.getAttributes();
追蹤、查看及篩選成效資料
在資訊主頁中追蹤特定指標
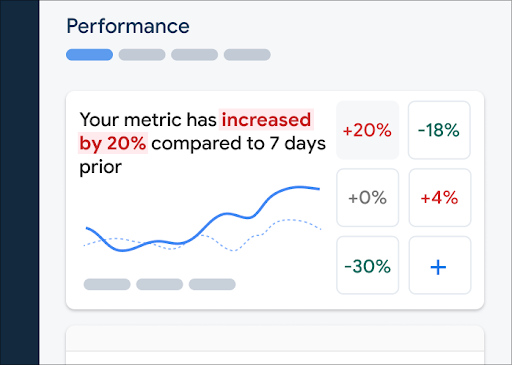
如要瞭解主要指標的趨勢,請在「成效」資訊主頁頂端新增指標面板。您可以查看每週變化,快速找出迴歸問題,或確認程式碼的近期變更是否能提升成效。
 Firebase Performance Monitoring 資訊主頁" />
如要將指標新增至指標看板,請按照下列步驟操作:
- 前往 Firebase 控制台的「效能」資訊主頁。
- 按一下空白指標資訊卡,然後選取要新增至看板的現有指標。
- 按一下已填入指標的資訊卡上的 ,即可查看更多選項,例如取代或移除指標。
指標面板會以圖表和數值百分比變化,顯示一段時間內收集到的指標資料。
進一步瞭解如何使用資訊主頁。
查看追蹤記錄及其資料
如要查看追蹤記錄,請前往 Firebase 控制台的「Performance」(效能) 資訊主頁,向下捲動至追蹤記錄表格,然後按一下適當的子分頁標籤。表格會顯示每項追蹤記錄的部分頂尖指標,您甚至可以依特定指標的百分比變化排序清單。
Performance Monitoring 會在 Firebase 控制台中提供疑難排解頁面,醒目顯示指標變化,方便您快速解決效能問題,盡量減少對應用程式和使用者的影響。當您發現潛在的效能問題時,可以使用疑難排解頁面,例如在下列情況:
- 您在資訊主頁上選取相關指標,並發現有大幅差異。
- 在追蹤記錄表格中,您會排序以在頂端顯示最大差異,並看到顯著的百分比變化。
- 您收到電子郵件快訊,通知您有成效問題。
你可以透過下列方式存取疑難排解頁面:
- 在指標資訊主頁上,按一下「查看指標詳細資料」按鈕。
- 在任一指標資訊卡上,依序選取
=>「查看詳細資料」 。疑難排解頁面會顯示所選指標的相關資訊。 - 在追蹤記錄表格中,按一下追蹤記錄名稱或與該追蹤記錄相關聯的列中任何指標值。
- 在電子郵件快訊中,按一下「立即調查」。
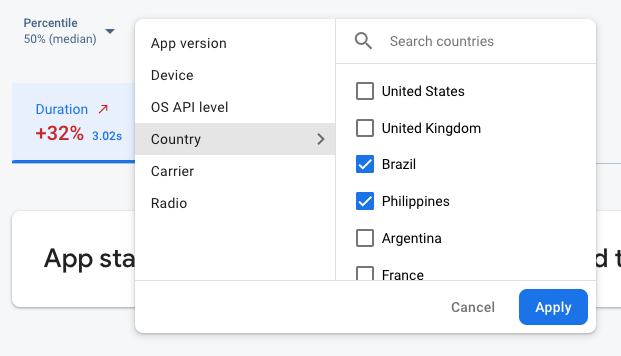
在追蹤記錄表格中點按追蹤記錄名稱,即可深入瞭解感興趣的指標。按一下「篩選」
 Firebase Performance Monitoring 資料,依屬性篩選" />
- 依「應用程式版本」篩選,查看先前或最新版本的資料
- 依「裝置」篩選,瞭解舊版裝置如何處理應用程式
- 依「國家/地區」篩選,確保資料庫位置不會影響特定區域
進一步瞭解如何查看追蹤記錄的資料。
後續步驟
進一步瞭解如何使用屬性檢查成效資料。
進一步瞭解如何在 Firebase 控制台中追蹤效能問題。
設定快訊,在程式碼變更導致應用程式效能下降時收到通知。舉例來說,如果特定自訂程式碼追蹤的時間長度超過您設定的門檻,您可以為團隊設定電子郵件快訊。
- 查看使用者工作階段的詳細報表,在同一工作階段收集的其他追蹤記錄的時間軸脈絡中,查看特定追蹤記錄。