在 Firebase Studio 中调试应用
使用集合让一切井井有条
根据您的偏好保存内容并对其进行分类。
Firebase Studio 提供了几种不同的方法,可直接从工作区调试您的应用。对于 Web 和 Flutter 应用,Web 控制台和 Lighthouse 会直接集成到工作区中。Flutter 应用提供 Android 和 Web 预览,支持在编码过程中快速检查和测试应用。
大多数常见语言还支持通过内置调试控制台进行更丰富的基于断点的调试,并可通过 OpenVSX 中的调试程序扩展程序进一步扩展功能。如需基于断点调试前端 Web 代码(例如 JavaScript),您可以继续使用浏览器的内置开发者工具,例如 Chrome 的开发者工具。
预览应用
Firebase Studio 提供工作区内应用预览,适用于 Web 应用 (Chrome) 和 Flutter 应用 (Android 和 Chrome)。Android 和 Chrome 预览支持热重载和热刷新,并提供完整的模拟器功能。
如需详细了解 Firebase Studio 预览,请参阅预览应用。
使用集成式 Web 控制台进行 Web 预览
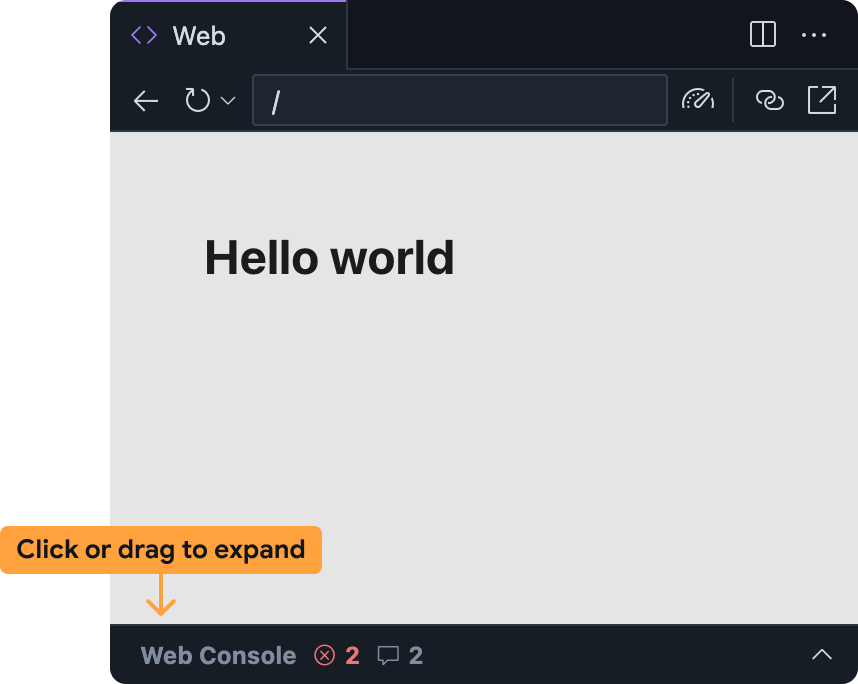
集成的 Web 控制台可帮助您直接从 Web 预览中诊断应用中的问题。您可以通过展开底部的栏,在 Firebase Studio Web 预览面板中访问 Web 控制台。
请注意,此功能仍处于实验阶段,默认未启用。如需启用该功能,请按以下步骤操作,并在体验后分享您的反馈:
将 Web 控制台添加到您的 Firebase Studio 工作区:
- 点击 settings 或按
Ctrl + ,
(在 Windows/Linux/ChromeOS 上)或 Cmd + ,
(在 MacOS 上)以打开设置。
- 找到 Firebase Studio:Web 开发者工具设置并启用该设置。如果您要直接修改
settings.json
文件,可以添加 "IDX.webDevTools": true
。
- 刷新浏览器窗口以重新加载您的 Firebase Studio 工作区。
在 Firebase Studio 中打开网页预览:打开命令面板(在 Mac 上按 Cmd+Shift+P
,在 ChromeOS、Windows 或 Linux 上按 Ctrl+Shift+P
),然后选择 Firebase Studio:显示 Web 预览。
默认情况下,Web 控制台面板会最小化到 Web 预览面板中。点击该栏或向上拖动以展开。
Firebase Studio Web 预览中的 Web 控制台面板的运作方式与其他控制台类似,例如 Chrome 开发者工具中的控制台:
- 在您使用应用时,JavaScript 错误和
console.log
语句将显示在该面板中。- 对于错误和警告,您还可以点击错误消息右侧的了解此错误按钮,从 Gemini 获取帮助。
- 您可以使用底部的提示栏在 Web 预览上下文中评估任意 JavaScript。
运行 Lighthouse 以进行 Web 预览
Lighthouse 会根据您选择的审核类别检查您的应用,并生成包含发现和建议的报告。您可以直接在 Firebase Studio 中的 Web 预览中运行 Lighthouse 报告。
在 Firebase Studio 中打开 Web 预览:打开命令面板(在 Mac 上按 Cmd+Shift+P
,在 ChromeOS、Windows 或 Linux 上按 Ctrl+Shift+P
),然后选择 Firebase Studio:显示 Web 预览。
点击 Web 预览工具栏中的
运行 Lighthouse 图标。
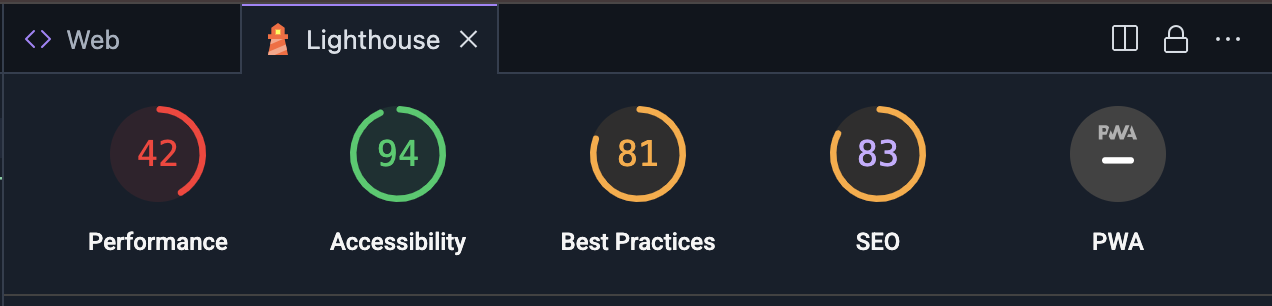
在 Lighthouse 面板中,选择所需的审核类别。您可以选择生成审核以下方面的报告:性能、无障碍、符合最佳实践、SEO 和渐进式 Web 应用性能。点击分析网页以生成报告。
生成报告可能需要几分钟时间。
报告生成后会显示在 Lighthouse 面板中,您可以查看每个审核类别的发现结果,或点击得分和类别名称在各类别之间切换。
使用调试控制台
Firebase Studio 包含来自 Code OSS 的内置调试控制台。您可以使用此控制台,通过适用于大多数常见编程语言的开箱即用调试程序调试应用,或从 OpenVSX 添加调试扩展程序。
如需自定义调试体验,您还可以向工作区添加 .vscode/launch.json
文件并指定自定义启动配置。如需详细了解如何使用启动配置文件自定义调试,请参阅 Visual Studio Code 调试配置。
使用 Gemini 进行调试
您可以在 Firebase 中使用 Gemini,以便在 Code 工作区或 App Prototyping agent 中通过聊天功能调试代码。
虽然 Gemini 可以为您编写代码,但有时也可能会产生错误。检测到错误时,它会尝试进行修正。如果您发现无法根据错误消息解决问题,可以尝试以下一些方法:
描述问题:在聊天界面中,尽可能简明扼要地描述您遇到的问题。虽然 Gemini 可能能访问错误消息和日志等上下文,但可能无法完全理解全部内容。同时描述行为和错误消息,有助于 Gemini 更快定位并修复错误。
提出具体问题:请大胆直接向 Gemini 询问您的代码相关问题。例如,“此函数中可能导致空指针异常的原因是什么?”或“如何防止这个竞态条件?”
分解复杂问题:如果您面临复杂问题,请将其拆分为更小、更易管理的部分。请 Gemini 帮助您逐一调试每个部分,并逐步分析问题。
使用代码块:分享代码片段时,请使用代码块格式,以确保代码排版正确。这样有助于 Gemini 更好地阅读和理解您的代码。
迭代和优化:Gemini 可能无法在第一次尝试时就提供最佳解决方案。请查看回答,提出澄清性问题,并根据需要提供更多信息。
避免提示循环:如果 Gemini 陷入循环或无法回答您的问题,请尝试重新表述提示或提供更多上下文信息。有时,仅仅换种说法提出问题,就能帮助 Gemini 更好地理解您的意图。
如果换种说法重复提示无法解决循环问题,请尝试以下方法:
如未另行说明,那么本页面中的内容已根据知识共享署名 4.0 许可获得了许可,并且代码示例已根据 Apache 2.0 许可获得了许可。有关详情,请参阅 Google 开发者网站政策。Java 是 Oracle 和/或其关联公司的注册商标。
最后更新时间 (UTC):2025-08-22。
[null,null,["最后更新时间 (UTC):2025-08-22。"],[],[],null,["Firebase Studio offers a few different ways to debug your app, directly\nfrom your workspace. For web and Flutter apps, a web console and\n[Lighthouse](https://developer.chrome.com/docs/lighthouse/overview)\nare directly integrated into the workspace. Flutter apps offer Android and web\npreviews to spot-check and test your app while you code.\n\nRicher, breakpoint-based debugging is also available for most common languages,\nthrough the built-in Debug Console, and extensible with [Debugger extensions\nfrom OpenVSX](https://open-vsx.org/?category=Debuggers). For\nbreakpoint-based debugging of your frontend web code (like JavaScript), you can\ncontinue using your browser's built-in developer tools, like\n[Chrome's DevTools](https://developer.chrome.com/docs/devtools).\n\nPreview your app\n\nFirebase Studio includes\n[in-workspace app previews](/docs/studio/preview-apps) for web apps (Chrome)\nand Flutter apps (Android, Chrome). The\nAndroid and Chrome previews support hot reload and hot refresh, and offer full\nemulator capabilities.\n\nTo learn more about Firebase Studio previews, see\n[Preview your app](/docs/studio/preview-apps).\n\nUse the integrated web console for web previews\n\nThe integrated web console helps you diagnose issues in your app directly\nfrom the web preview. You can access the web console in the\nFirebase Studio web preview panel by expanding the bar at the bottom.\n\nNote that this feature is experimental and isn't enabled by default. To\nturn it on, follow these steps, and [share your\nfeedback](/support/troubleshooter/studio) after\nyou've tried it out:\n\n1. Add the web console to your Firebase Studio workspace:\n\n 1. Open **Settings** by clicking settings or pressing `Ctrl + ,` (on Windows/Linux/ChromeOS) or `Cmd + ,` (on MacOS).\n 2. Find the **Firebase Studio: Web Dev Tools** setting and enable it. If you're editing your `settings.json` file directly, you can add `\"IDX.webDevTools\": true`.\n 3. Refresh your browser window to reload your Firebase Studio workspace.\n2. Open the web preview in Firebase Studio: Open the command palette\n (`Cmd+Shift+P` on Mac or `Ctrl+Shift+P` on ChromeOS, Windows, or Linux)\n and select **Firebase Studio: Show Web Preview**.\n\n3. The web console panel is minimized within the web preview panel by default.\n Click the bar or drag it up to expand it.\n\nThe web console panel in the Firebase Studio web preview works\nsimilarly to other consoles, such as the one available in\n[Chrome DevTools](https://developer.chrome.com/docs/devtools):\n\n- JavaScript errors and `console.log` statements will appear there as you use your app.\n - For errors and warnings, you also have the option to get assistance from Gemini by selecting the **Understand this error** button at the right of the error message.\n- You can evaluate arbitrary JavaScript in the context of your web preview by using the prompt bar at the bottom.\n\nRun Lighthouse for web previews\n\n[Lighthouse](https://developer.chrome.com/docs/lighthouse/overview)\naudits your app based on the specific audit categories you select, and returns\na report with findings and suggestions. You can run Lighthouse reports directly\nfrom the web preview in Firebase Studio.\n\n1. Open the web preview in Firebase Studio: Open the command palette\n (`Cmd+Shift+P` on Mac or `Ctrl+Shift+P` on ChromeOS, Windows, or\n Linux) select **Firebase Studio: Show Web Preview**.\n\n2. Click the\n **Run Lighthouse** icon from the web preview toolbar.\n\n3. In\n the Lighthouse panel, select the audit categories you want. You can\n choose from reports auditing [performance](https://developer.chrome.com/docs/lighthouse/performance/performance-scoring), [accessibility](https://developer.chrome.com/docs/lighthouse/accessibility/scoring),\n [conformance with best practices](https://developer.chrome.com/docs/lighthouse/best-practices/doctype), [SEO](https://developer.chrome.com/docs/lighthouse/seo/meta-description), and [Progressive Web\n App performance](https://developer.chrome.com/docs/lighthouse/pwa/load-fast-enough-for-pwa). Click **Analyze page** to generate the reports.\n\n The reports might take a few minutes to generate.\n4. After the reports appear in the Lighthouse panel, you can review the\n findings for each audit category, or switch between audit categories by\n clicking the score and category name.\n\nUse the Debug Console\n\nFirebase Studio includes the built-in Debug Console from Code OSS. Use this\nconsole to debug your app with out-of-the-box debuggers for most common\nprogramming languages, or add a debugging extension from\n[OpenVSX](https://open-vsx.org/?category=Debuggers).\n\nTo customize your debugging experience, you can also add a `.vscode/launch.json`\nfile to your workspace and specify custom launch configurations. Learn more\nabout using launch configuration files to customize debugging at\n[Visual Studio Code debug\nconfiguration](https://github.com/microsoft/vscode-docs/blob/main/docs/debugtest/debugging-configuration.md).\n\nDebug with Gemini\n\nYou can use Gemini in Firebase to help you debug your code with\nchat in your **Code** workspace\nor the App Prototyping agent.\n\nWhile Gemini can write code for you, it might sometimes also\nproduce errors. When it detects an error, it will attempt\nto fix it. If you find that it isn't able to resolve the issue given\nthe error message, you can try some of the following techniques:\n\n- **Describe the issue:** In the chat interface, describe the\n problem you're encountering as clearly and concisely as possible.\n While Gemini might have access to context like error messages\n and logs, it might not understand the full context. Describing the behavior\n along with the error message can help Gemini fix errors\n faster.\n\n- **Ask specific questions:** Don't be afraid to ask Gemini\n direct questions about your code. For example, \"What could be causing a\n null pointer exception in this function?\" or \"How can I prevent\n this race condition?\"\n\n- **Break down complex problems:** If you're dealing with a complex\n issue, break it down into smaller, more manageable parts. Ask\n Gemini to help you debug each part separately and think\n through problems step-by-step.\n\n- **Use code fences:** When sharing code snippets, use code fences\n to ensure that the code is properly formatted. This makes it easier\n for Gemini to read and understand your code.\n\n- **Iterate and refine:** Gemini may not always provide the perfect\n solution on the first try. Review the responses, ask clarifying\n questions, and provide additional information as needed.\n\n- **Avoid prompting loops:** If Gemini gets stuck in a loop or is\n unable to answer your question, try rephrasing your prompt or\n providing additional context. Sometimes, just rewording your\n question can help Gemini understand what you're asking.\n\n If rephrasing your prompt doesn't resolve the loop, try\n the following techniques:\n - **Start a new chat:** If you're using Gemini in Firebase\n chat in your Code\n workspace, start a new chat session to reset\n Gemini's context. This can help break free from any\n misconceptions or assumptions that Gemini may have made\n in the previous conversation.\n\n - **Provide counter-examples:** If Gemini is making incorrect\n assumptions, provide counter-examples to help it understand\n the correct behavior."]]