
1. Introducción
En este codelab, aprenderás a usar las funciones avanzadas de Crashlytics, que te brindarán una mejor visibilidad de las fallas y las circunstancias que podrían haberlas causado.
Agregarás una nueva funcionalidad a un juego de ejemplo, MechaHamster: Sube de nivel con Firebase Edition. Este juego de ejemplo es una nueva versión del clásico juego de Firebase MechaHamster que quita la mayoría de sus funciones integradas de Firebase, lo que te brinda la oportunidad de implementar nuevos usos de Firebase en su lugar.
Agregarás un menú de depuración al juego. Este menú de depuración llama a los métodos que crearás y te permite probar las diferentes funcionalidades de Crashlytics. Estos métodos te mostrarán cómo anotar tus informes de fallas automáticos con claves personalizadas, registros personalizados, errores recuperables y mucho más.
Después de crear el juego, usarás el menú de depuración y analizarás los resultados para comprender la vista única que proporcionan sobre cómo se ejecuta tu juego en el mundo real.
Qué aprenderás
- Son los tipos de errores que Crashlytics detecta automáticamente.
- Son errores adicionales que se pueden registrar de forma intencional.
- Cómo agregar más información a estos errores para que sean más fáciles de comprender
Requisitos
- Unity (versión mínima recomendada 2019 o posterior) con uno o ambos de los siguientes elementos:
- Compatibilidad con la compilación para iOS
- Compatibilidad con la compilación de Android
- (Solo para Android) Firebase CLI (se usa para subir símbolos para los informes de fallas)
- Sigue las instrucciones para instalar Firebase CLI.
Si ya instalaste la CLI, asegúrate de actualizarla a su versión más reciente.
- Sigue las instrucciones para instalar Firebase CLI.
2. Configura tu entorno de desarrollo
En las siguientes secciones, se describe cómo descargar el código de Level Up with Firebase y abrirlo en Unity.
Ten en cuenta que este juego de ejemplo de Level Up with Firebase se usa en varios otros codelabs de Firebase y Unity, por lo que es posible que ya hayas completado las tareas de esta sección. Si es así, puedes ir directamente al último paso de esta página: "Agrega los SDKs de Firebase para Unity".
Descarga el código
Clona el repositorio de GitHub de este codelab desde la línea de comandos:
git clone https://github.com/firebase/level-up-with-firebase.git
También tienes la opción de descargar el repositorio como archivo ZIP si no tienes instalado git.
Abre Level Up with Firebase en el editor de Unity.
- Inicia Unity Hub y, en la pestaña Proyectos, haz clic en la flecha del menú desplegable junto a Abrir.
- Haz clic en Agregar proyecto desde el disco.
- Navega al directorio que contiene el código y, luego, haz clic en Aceptar.
- Si se te solicita, selecciona una versión del editor de Unity para usar y tu plataforma de destino (Android o iOS).
- Haz clic en el nombre del proyecto, level-up-with-firebase, y se abrirá en el editor de Unity.
- Si el editor no lo abre automáticamente, abre
MainGameSceneen Assets > Hamster en la pestaña Project del editor de Unity.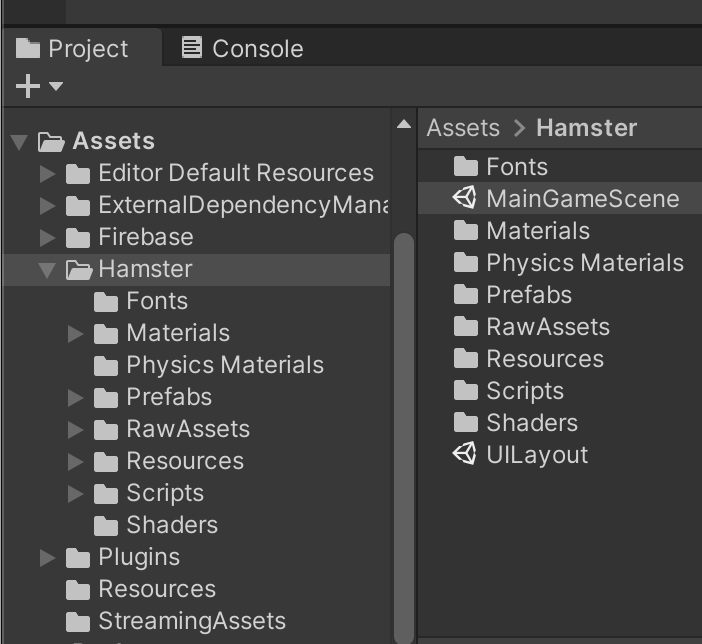
Para obtener más información sobre cómo instalar y usar Unity, consulta Trabaja en Unity.
3. Agrega Firebase a tu proyecto de Unity
Crea un proyecto de Firebase
- Accede a la consola de Firebase con tu Cuenta de Google.
- Haz clic en el botón para crear un proyecto nuevo y, luego, ingresa un nombre (por ejemplo,
Mechahamster Codelab).
- Haz clic en Continuar.
- Si se te solicita, revisa y acepta las Condiciones de Firebase y, luego, haz clic en Continuar.
- (Opcional) Habilita la asistencia de IA en Firebase console (llamada "Gemini en Firebase").
- Para este codelab, necesitas Google Analytics para usar de forma óptima los productos de Firebase, así que mantén activado el botón de activación de la opción de Google Analytics. Sigue las instrucciones en pantalla para configurar Google Analytics.
- Haz clic en Crear proyecto, espera a que se aprovisione y, luego, haz clic en Continuar.
Registra tu app en Firebase
- En Firebase console, en el centro de la página de descripción general del proyecto, haz clic en el ícono de Unity para iniciar el flujo de trabajo de configuración o, si ya agregaste una app a tu proyecto de Firebase, haz clic en Agregar app para mostrar las opciones de plataforma.
- Selecciona esta opción para registrar los destinos de compilación de Apple (iOS) y Android.
- Ingresa el ID del proyecto de Unity específico de cada plataforma. Para este codelab, ingresa lo siguiente:
- Para Apple (iOS): Ingresa
com.google.firebase.level-upen el campo ID del paquete de iOS. - Android: Ingresa
com.google.firebase.level_upen el campo Nombre del paquete de Android.
- Para Apple (iOS): Ingresa
- (Opcional) Ingresa el sobrenombre específico de cada plataforma para tu proyecto de Unity.
- Haz clic en Registrar app y, luego, ve a la sección Descargar archivo de configuración.
Agrega archivos de configuración de Firebase
Después de hacer clic en Registrar app, se te pedirá que descargues dos archivos de configuración (uno para cada destino de compilación). Tu proyecto de Unity necesita los metadatos de Firebase en estos archivos para conectarse con Firebase.
- Descarga los dos archivos de configuración disponibles:
- Para Apple (iOS): Descarga GoogleService-Info.plist.
- Android: Descarga google-services.json.
- Abre la ventana Project de tu proyecto de Unity y, luego, transfiere ambos archivos de configuración a la carpeta Assets.
- Vuelve a Firebase console y, en el flujo de trabajo de configuración, haz clic en Siguiente y continúa con la sección Agrega los SDKs de Firebase para Unity.
Agrega los SDKs de Firebase para Unity
- Haz clic en Descargar el SDK de Firebase Unity en Firebase console.
- Descomprime el SDK en la ubicación que prefieras.
- En tu proyecto de Unity abierto, ve a Assets > Import Package > Custom Package.
- En el diálogo Import package, navega al directorio que contiene el SDK descomprimido, selecciona
FirebaseAnalytics.unitypackagey, luego, haz clic en Open. - En el diálogo Import Unity Package que aparece, haz clic en Import.
- Repite los pasos anteriores para importar
FirebaseCrashlytics.unitypackage. - Vuelve a Firebase console y, en el flujo de trabajo de configuración, haz clic en Siguiente.
Para obtener más información sobre cómo agregar los SDKs de Firebase a proyectos de Unity, consulta Opciones de instalación adicionales de Unity.
4. Configura Crashlytics en tu proyecto de Unity
Para usar Crashlytics en proyectos de Unity, deberás realizar algunos pasos de configuración adicionales. Por supuesto, deberás inicializar el SDK. Sin embargo, también deberás subir tus símbolos para poder ver los seguimientos de pila simbolizados en Firebase console y forzar una falla de prueba para asegurarte de que Firebase reciba tus eventos de falla.
Inicializa el SDK de Crashlytics
- En
Assets/Hamster/Scripts/MainGame.cs, agrega las siguientes instruccionesusing:using Firebase.Crashlytics; using Firebase.Extensions;using, el siguiente código no funcionará. - Aún en
MainGame.cs, agrega la inicialización de Firebase al métodoStart()existente llamando aInitializeFirebaseAndStartGame():void Start() { Screen.SetResolution(Screen.width / 2, Screen.height / 2, true); InitializeFirebaseAndStartGame(); } - Y, de nuevo, en
MainGame.cs, buscaInitializeFirebaseAndStartGame(), declara una variable de la app y, luego, sobrescribe la implementación del método de la siguiente manera:public Firebase.FirebaseApp app = null; // Begins the firebase initialization process and afterwards, opens the main menu. private void InitializeFirebaseAndStartGame() { Firebase.FirebaseApp.CheckAndFixDependenciesAsync() .ContinueWithOnMainThread( previousTask => { var dependencyStatus = previousTask.Result; if (dependencyStatus == Firebase.DependencyStatus.Available) { // Create and hold a reference to your FirebaseApp, app = Firebase.FirebaseApp.DefaultInstance; // Set the recommended Crashlytics uncaught exception behavior. Crashlytics.ReportUncaughtExceptionsAsFatal = true; InitializeCommonDataAndStartGame(); } else { UnityEngine.Debug.LogError( $"Could not resolve all Firebase dependencies: {dependencyStatus}\n" + "Firebase Unity SDK is not safe to use here"); } }); }
Colocar la lógica de inicialización aquí evita la interacción del jugador antes de que se inicialicen las dependencias de Firebase.
En las Preguntas frecuentes de Crashlytics, se analizan los beneficios y los efectos de informar las excepciones no controladas como irrecuperables.
Compila tu proyecto y sube símbolos
Los pasos para compilar y subir símbolos son diferentes para las apps para iOS y Android.
iOS+ (plataforma de Apple)
- Desde el diálogo Build Settings, exporta tu proyecto a un lugar de trabajo de Xcode.
- Compila tu app.
En el caso de las plataformas de Apple, el complemento de Firebase Unity Editor configura automáticamente tu proyecto de Xcode para generar y subir un archivo de símbolos compatible con Crashlytics a los servidores de Firebase de cada compilación. Esta información de símbolos es necesaria para ver seguimientos de pila simbolizados en el panel de Crashlytics.
Android
- (solo durante la configuración inicial, no para cada compilación) Configura tu compilación:
- Crea una carpeta nueva llamada Builds en la raíz del directorio de tu proyecto (es decir, como carpeta hermana de tu directorio Assets) y, luego, crea una subcarpeta llamada Android.
- En File > Build Settings > Player Settings > Configuration, establece Scripting Backend en IL2CPP.
- Por lo general, IL2CPP hace que las compilaciones sean más pequeñas y tengan un mejor rendimiento.
- IL2CPP también es la ÚNICA opción disponible en iOS, y seleccionarla aquí permite que las dos plataformas tengan una mejor paridad y que la depuración de las diferencias entre ambas (si decides compilar para ambas) sea más sencilla.
- Compila tu app. En File > Build Settings, completa lo siguiente:
- Asegúrate de que la opción Create symbols.zip esté marcada (o, si se muestra un menú desplegable, selecciona Debugging).
- Compila tu APK directamente desde Unity Editor en la subcarpeta Builds/Android que acabas de crear.
- Una vez que finalice la compilación, debes generar un archivo de símbolos compatible con Crashlytics y subirlo a los servidores de Firebase. Esta información de símbolos es necesaria para ver seguimientos de pila simbolizados sobre fallas de bibliotecas nativas en el panel de Crashlytics.
Ejecuta el siguiente comando de Firebase CLI para generar y subir este archivo de símbolos:firebase crashlytics:symbols:upload --app=<FIREBASE_APP_ID> <PATH/TO/SYMBOLS>
FIREBASE_APP_ID: Es el ID de la app de Firebase para Android (no el nombre del paquete). Encuentra este valor en el archivogoogle-services.jsonque descargaste antes. Es el valor demobilesdk_app_id.
ID de ejemplo de la app de Firebase para Android:1:567383003300:android:17104a2ced0c9b9bPATH/TO/SYMBOLS: Es la ruta de acceso del archivo de símbolos comprimido que se generó en el directorio Builds/Android cuando finalizó la compilación (por ejemplo,Builds/Android/myapp-1.0-v100.symbols.zip).
Fuerza una falla de prueba para finalizar la configuración
Para finalizar la configuración de Crashlytics y ver los datos iniciales en el panel de Crashlytics de Firebase console, debes forzar una falla de prueba.
- En MainGameScene, busca EmptyObject
GameObjecten la jerarquía del editor, agrégale la siguiente secuencia de comandos y, luego, guarda la escena. Esta secuencia de comandos causará una falla de prueba unos segundos después de ejecutar la app.using System; using UnityEngine; public class CrashlyticsTester : MonoBehaviour { // Update is called once per frame void Update() { // Tests your Crashlytics implementation by // throwing an exception every 60 frames. // You should see reports in the Firebase console // a few minutes after running your app with this method. if(Time.frameCount >0 && (Time.frameCount%60) == 0) { throw new System.Exception("Test exception; please ignore"); } } } - Compila tu app y sube la información de los símbolos después de que termine el proceso.
- iOS: El complemento Firebase Unity Editor configura automáticamente tu proyecto de Xcode para subir tu archivo de símbolos.
- Android: Ejecuta el comando
crashlytics:symbols:uploadde Firebase CLI para subir tu archivo de símbolos.
- Ejecuta la app. Después de hacerlo, revisa el registro del dispositivo y espera a que se active la excepción desde
CrashlyticsTester.- iOS: Puedes ver los registros en el panel inferior de Xcode.
- Android: Ejecuta el comando
adb logcaten la terminal para ver los registros.
- Visita el panel de Crashlytics para ver la excepción. La verás en la tabla Problemas en la parte inferior del panel. Más adelante en el codelab, aprenderás a explorar estos informes.
- Una vez que confirmes que el evento se subió a Crashlytics, selecciona el objeto EmptyObject
GameObjectal que lo adjuntaste, quita solo el componenteCrashlyticsTestery, luego, guarda la escena para restablecerla a su estado original.
5. Cómo habilitar y comprender el menú de depuración
Hasta ahora, agregaste Crashlytics a tu proyecto de Unity, completaste la configuración y confirmaste que el SDK de Crashlytics sube eventos a Firebase. Ahora crearás un menú en tu proyecto de Unity que demostrará cómo usar la funcionalidad más avanzada de Crashlytics en tu juego. El proyecto de Unity Level Up with Firebase ya tiene un menú de depuración oculto que harás visible y para el que escribirás la funcionalidad.
Cómo habilitar el menú de depuración
El botón para acceder al menú de depuración existe en tu proyecto de Unity, pero no está habilitado actualmente. Debes habilitar el botón para acceder a él desde el prefab MainMenu:
- En el editor de Unity, abre el prefab llamado
MainMenu.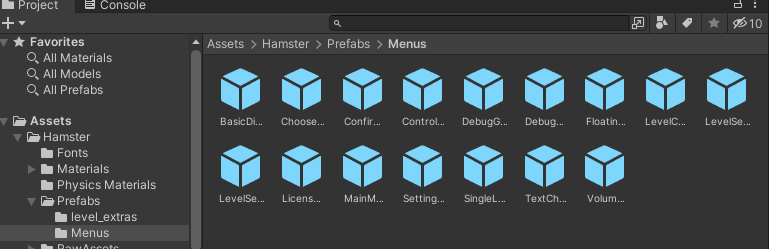
- En la jerarquía del arquetipo, busca el subobjeto inhabilitado llamado
DebugMenuButtony, luego, selecciónalo.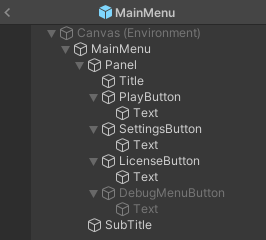
- Habilita
DebugMenuButtonmarcando la casilla en la esquina superior izquierda, a la izquierda del campo de texto que contieneDebugMenuButton.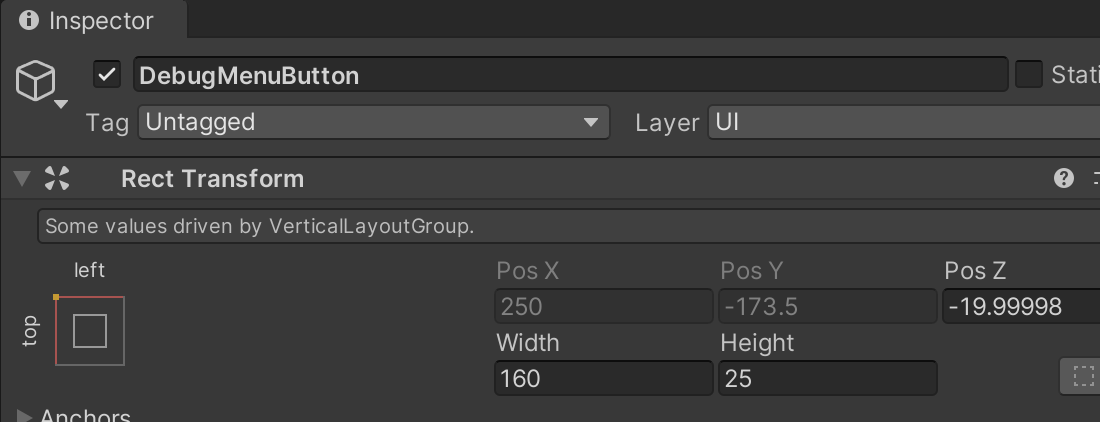
- Guarda el prefab.
- Ejecuta el juego en el editor o en tu dispositivo. Ahora deberías poder acceder al menú.
Obtén una vista previa y comprende los cuerpos de los métodos del menú de depuración
Más adelante en este codelab, escribirás cuerpos de métodos para algunos métodos de Crashlytics de depuración preconfigurados. Sin embargo, en el proyecto de Unity Level Up with Firebase, los métodos se definen en DebugMenu.cs y se llaman desde allí.
Si bien algunos de estos métodos llamarán a los métodos de Crashlytics y arrojarán errores, la capacidad de Crashlytics para detectar estos errores no depende de que se llamen a esos métodos primero. Por el contrario, los informes de fallas que se generan a partir de la detección automática de errores se mejorarán con la información que agregan estos métodos.
Abre DebugMenu.cs y, luego, busca los siguientes métodos:
Métodos para generar y anotar problemas de Crashlytics:
CrashNowLogNonfatalErrorLogStringsAndCrashNowSetAndOverwriteCustomKeyThenCrashSetLogsAndKeysBeforeANR
Métodos para registrar eventos de Analytics y ayudar en la depuración:
LogProgressEventWithStringLiteralsLogIntScoreWithBuiltInEventAndParams
En los pasos posteriores de este codelab, implementarás estos métodos y aprenderás cómo ayudan a abordar situaciones específicas que pueden ocurrir en el desarrollo de juegos.
6. Cómo garantizar la entrega de informes de fallas durante el desarrollo
Antes de comenzar a implementar estos métodos de depuración y ver cómo afectan los informes de fallas, asegúrate de comprender cómo se informan los eventos a Crashlytics.
En el caso de los proyectos de Unity, los eventos de fallas y excepciones en tu juego se escriben de inmediato en el disco. En el caso de las excepciones no detectadas que no producen fallas en el juego (por ejemplo, excepciones de C# no detectadas en la lógica del juego), puedes hacer que el SDK de Crashlytics las informe como eventos irrecuperables si configuras la propiedad Crashlytics.ReportUncaughtExceptionsAsFatal como true, de este modo inicializas Crashlytics en tu proyecto de Unity. Estos eventos se informan a Crashlytics en tiempo real sin necesidad de que el usuario final reinicie el juego. Ten en cuenta que las fallas por error en código nativo siempre se informan como eventos irrecuperables y se envían cuando un usuario final reinicia el juego.
Además, ten en cuenta las siguientes diferencias pequeñas, pero significativas, entre la forma en que los diferentes entornos de ejecución envían información de Crashlytics a Firebase:
Simulador de iOS:
- La información de Crashlytics se registra solo si desconectas Xcode del simulador. Si Xcode está conectado, detecta los errores antes de que lleguen al destino, lo que impide la entrega de información.
Dispositivos físicos móviles (iOS y Android):
- Específico de Android: Los errores de ANR solo se informan en Android 11 y versiones posteriores. Los errores de ANR y los eventos recuperables se informan en la próxima ejecución.
Unity Editor:
- La información de Crashlytics del editor en el modo de reproducción o en el modo independiente NO se registra ni se sube a Firebase. Además, el flujo de trabajo de desarrollo para computadoras de escritorio de Firebase no admite Crashlytics.
Prueba la falla de tu juego con solo presionar un botón en CrashNow()
Después de configurar Crashlytics en tu juego, el SDK de Crashlytics registrará automáticamente las fallas y las excepciones no controladas, y las subirá a Firebase para su análisis. Los informes se muestran en el panel de Crashlytics en Firebase console.
- Para demostrar que esto es automático, abre
DebugMenu.csy, luego, anula el métodoCrashNow()de la siguiente manera:void CrashNow() { TestCrash(); } - Crea la app.
- (Solo para Android) Ejecuta el siguiente comando de Firebase CLI para subir tus símbolos:
firebase crashlytics:symbols:upload --app=<FIREBASE_APP_ID> <PATH/TO/SYMBOLS>
- Presiona el botón Crash Now y continúa con el siguiente paso de este codelab para descubrir cómo ver e interpretar el informe de fallas.
7. Comprende los informes de problemas en Firebase console
Cuando se trata de ver tus informes de fallas, debes saber un poco más sobre cómo aprovecharlos al máximo. Cada uno de los métodos que escribas mostrará cómo agregar diferentes tipos de información a los informes de Crashlytics.
- Presiona el botón Crash Now y, luego, reinicia la app.
- Ve al panel de Crashlytics. Desplázate hacia abajo hasta la tabla Problemas en la parte inferior del panel, donde Crashlytics agrupa los eventos que tienen la misma causa raíz en "problemas".
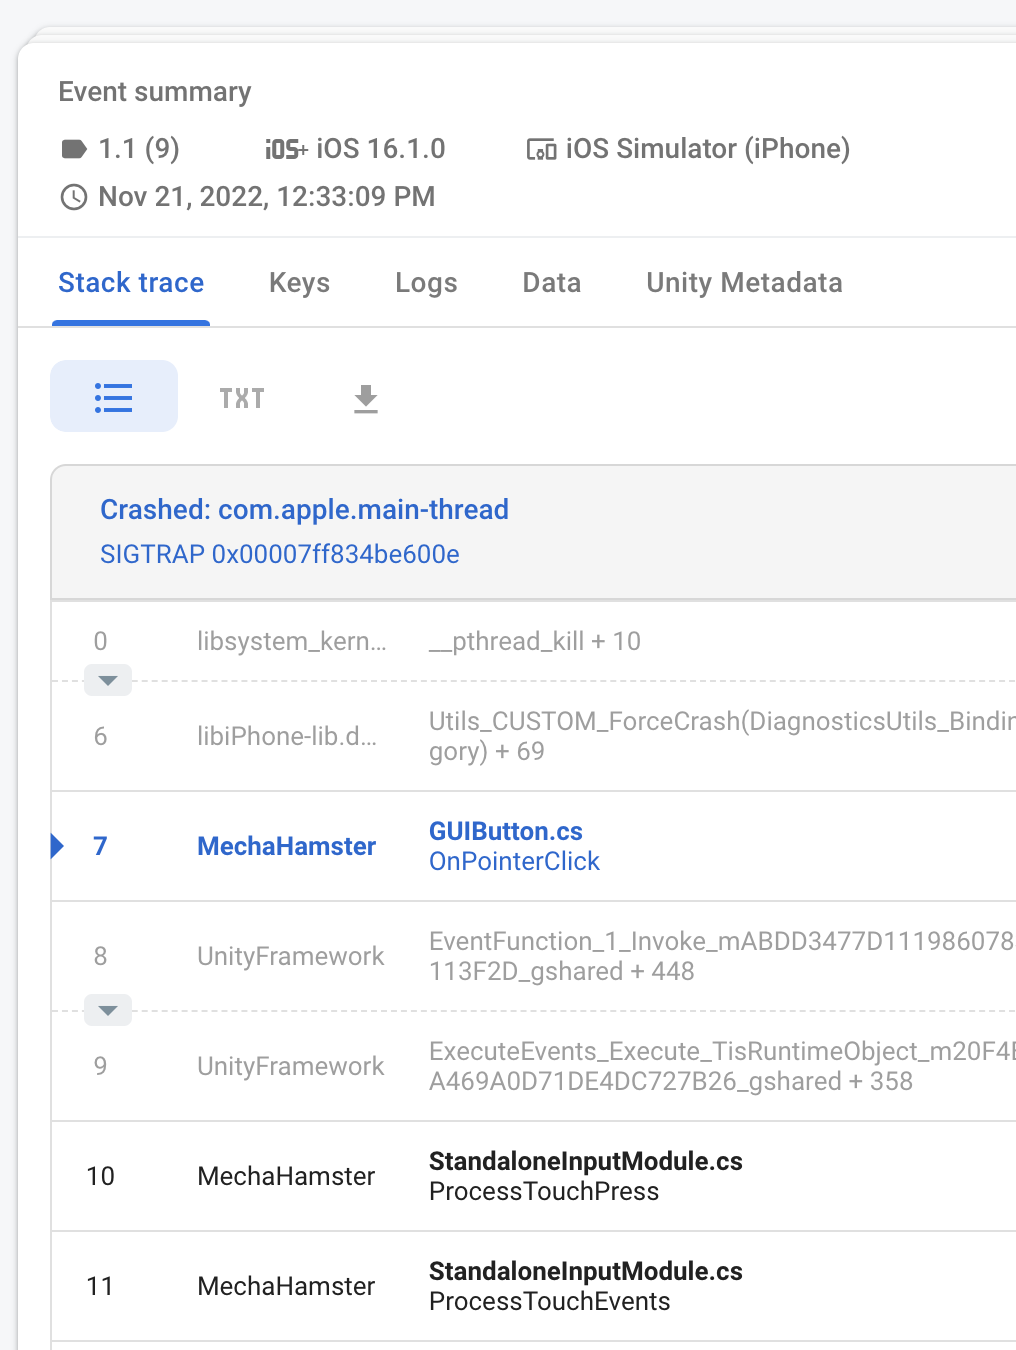
- Haz clic en el problema nuevo que aparece en la tabla Problemas. Si lo haces, se mostrará el Resumen del evento sobre cada evento individual que se envió a Firebase.
Deberías ver algo similar a la siguiente captura de pantalla. Observa cómo el Resumen del evento muestra de forma destacada el registro de seguimiento de la llamada que provocó la falla.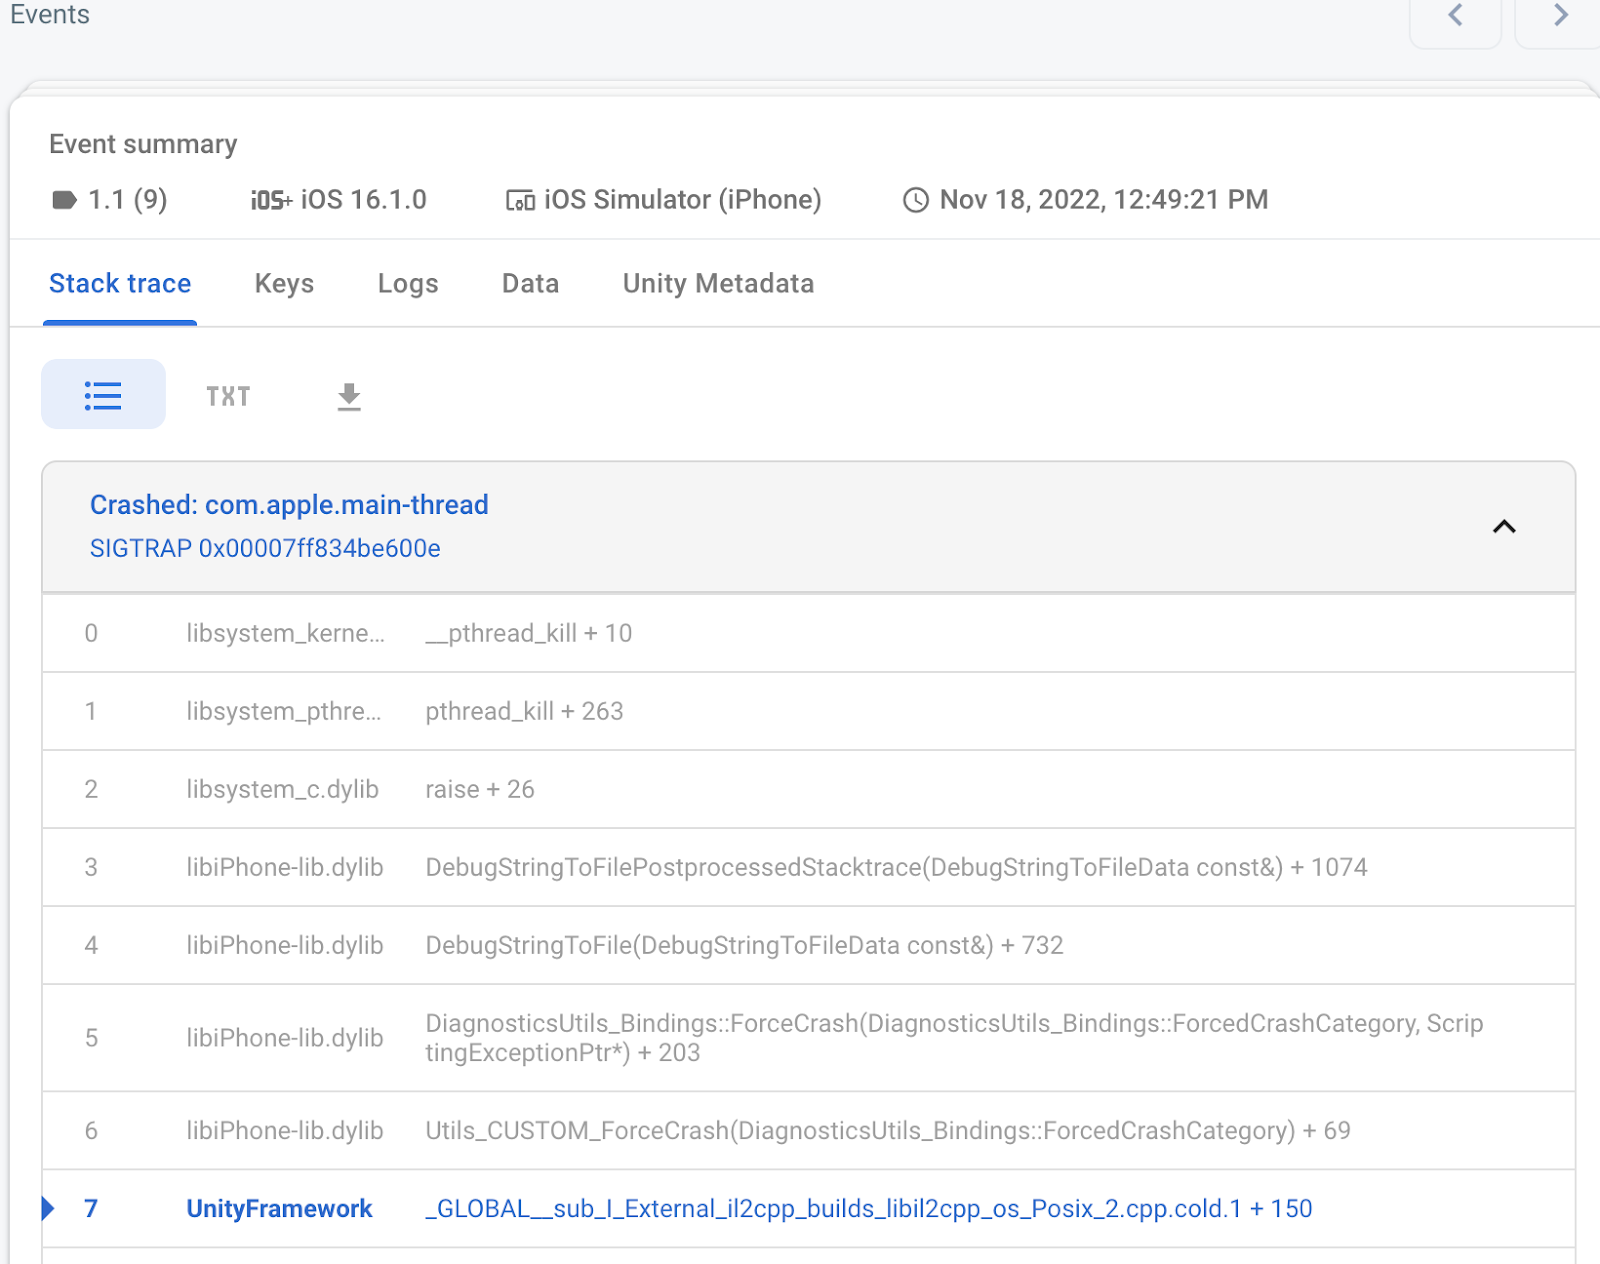
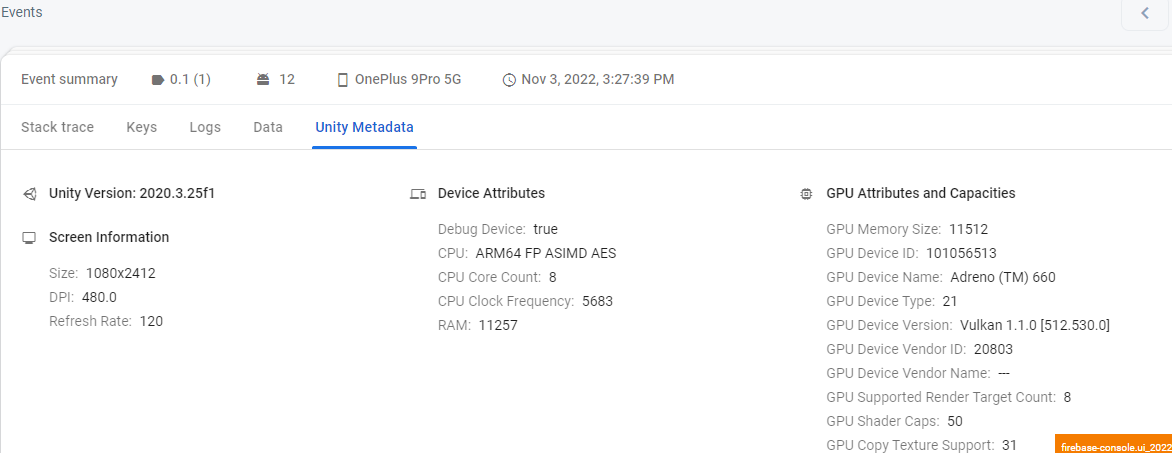
Metadatos adicionales
Otra pestaña útil es Unity Metadata. En esta sección, se informa sobre los atributos del dispositivo en el que ocurrió el evento, incluidas las características físicas, el modelo o las especificaciones de la CPU y todo tipo de métricas de la GPU.
Este es un ejemplo en el que la información de esta pestaña podría ser útil:
Imagina que tu juego usa sombreadores de forma intensiva para lograr un aspecto determinado, pero no todos los teléfonos tienen GPUs capaces de renderizar esta función. La información de la pestaña Unity Metadata puede darte una mejor idea del hardware para el que tu app debería realizar pruebas cuando decidas qué funciones habilitar automáticamente o inhabilitar por completo.
Si bien es posible que nunca se produzca un error o una falla en tu dispositivo, debido a la gran diversidad de dispositivos Android disponibles, es útil comprender mejor los "puntos críticos" particulares de los dispositivos de tu público.
8. Cómo arrojar, detectar y registrar una excepción
A menudo, como desarrollador, incluso si tu código detecta y controla correctamente una excepción de tiempo de ejecución, es bueno tener en cuenta que ocurrió y en qué circunstancias. Crashlytics.LogException se puede usar para este propósito exacto: enviar un evento de excepción a Firebase para que puedas depurar aún más el problema en Firebase console.
- En
Assets/Hamster/Scripts/States/DebugMenu.cs, agrega lo siguiente a las instruccionesusing:// Import Firebase using Firebase.Crashlytics; - Aún en
DebugMenu.cs, sobrescribeLogNonfatalError()de la siguiente manera:void LogNonfatalError() { try { throw new System.Exception($"Test exception thrown in {nameof(LogNonfatalError)}"); } catch(System.Exception exception) { Crashlytics.LogException(exception); } } - Crea la app.
- (Solo para Android) Ejecuta el siguiente comando de Firebase CLI para subir tus símbolos:
firebase crashlytics:symbols:upload --app=<FIREBASE_APP_ID> <PATH/TO/SYMBOLS>
- Presiona el botón Log Nonfatal Error y, luego, reinicia la app.
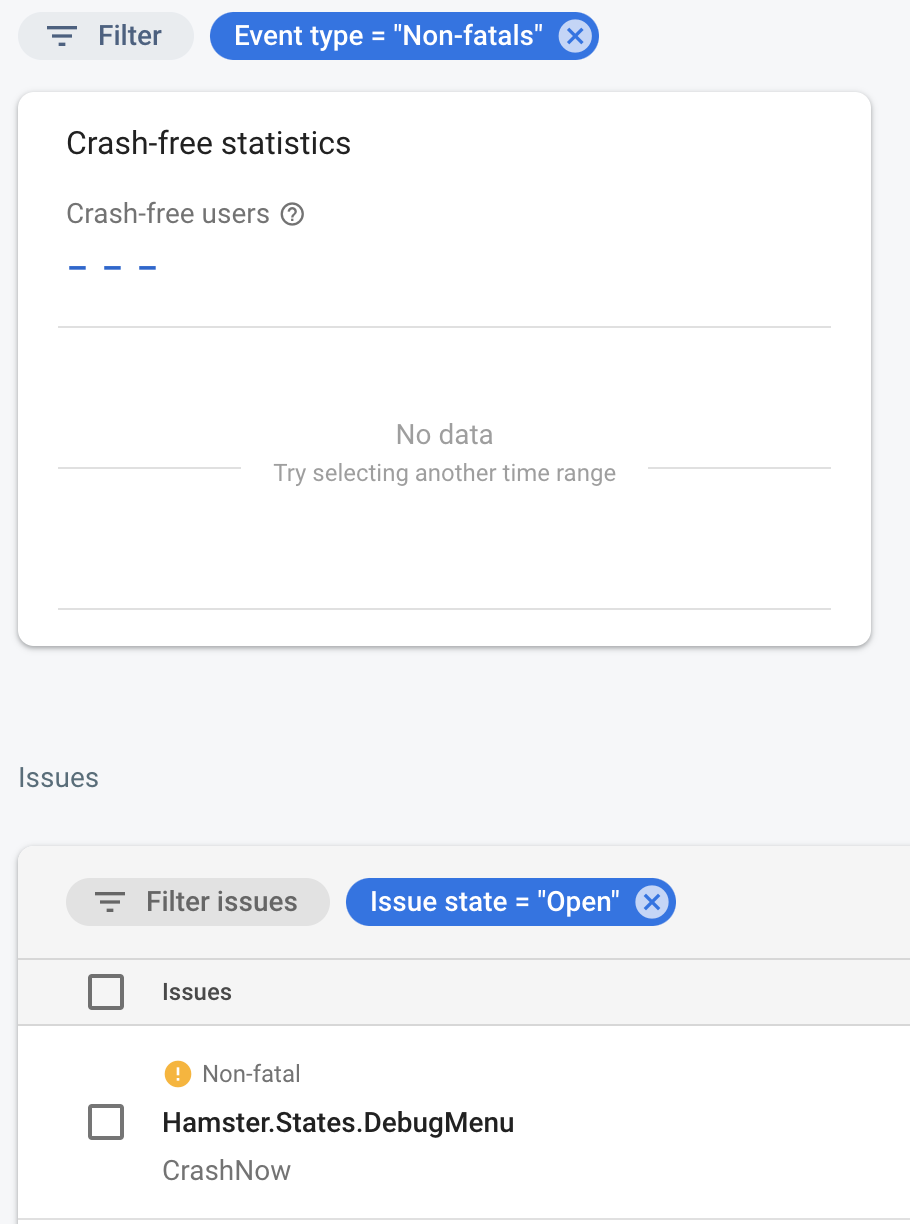
- Ve al panel de Crashlytics y deberías ver algo similar a lo que viste en el último paso de este codelab.
- Sin embargo, esta vez, restringe el filtro Tipo de evento a Recuperables para que solo veas los errores recuperables, como el que acabas de registrar.
9. Registra cadenas en Crashlytics para comprender mejor el flujo de ejecución del programa
¿Alguna vez intentaste averiguar por qué una línea de código que se llama desde varias rutas, cientos o incluso miles de veces por sesión, puede generar de repente una excepción o fallar? Si bien puede ser útil revisar el código en un IDE y observar los valores más de cerca, ¿qué sucede si esto solo ocurre entre un porcentaje muy pequeño de tus usuarios? Peor aún, ¿qué harías si no puedes replicar esta falla sin importar lo que hagas?
En situaciones como esta, tener algo de contexto puede marcar una gran diferencia. Con Crashlytics.Log, puedes escribir el contexto que necesitas. Piensa en estos mensajes como pistas para tu yo del futuro sobre lo que podría estar sucediendo.
Si bien los registros se pueden usar de muchas maneras, suelen ser más útiles para registrar situaciones en las que el orden o la ausencia de llamadas son una información de vital importancia.
- En
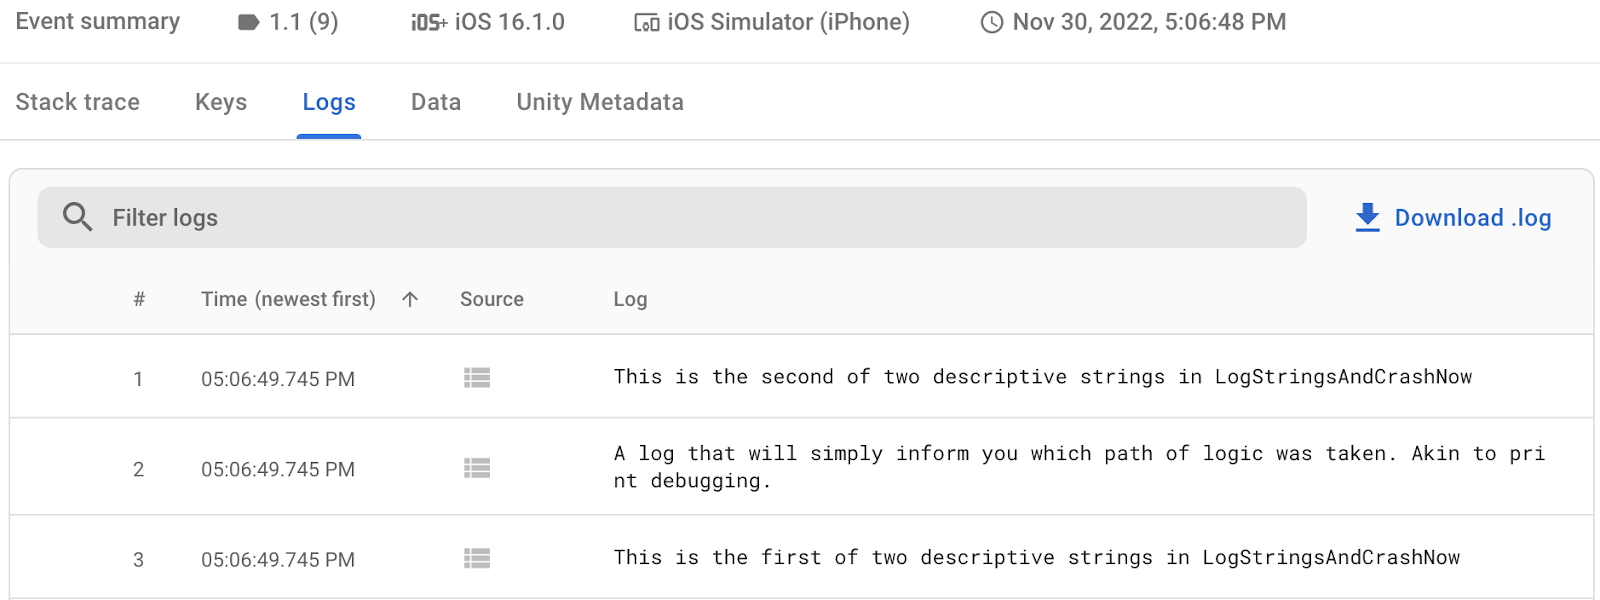
Assets/Hamster/Scripts/States/DebugMenu.cs, sobrescribeLogStringsAndCrashNow()de la siguiente manera:void LogStringsAndCrashNow() { Crashlytics.Log($"This is the first of two descriptive strings in {nameof(LogStringsAndCrashNow)}"); const bool RUN_OPTIONAL_PATH = false; if(RUN_OPTIONAL_PATH) { Crashlytics.Log(" As it stands, this log should not appear in your records because it will never be called."); } else { Crashlytics.Log(" A log that will simply inform you which path of logic was taken. Akin to print debugging."); } Crashlytics.Log($"This is the second of two descriptive strings in {nameof(LogStringsAndCrashNow)}"); TestCrash(); } - Crea la app.
- (Solo para Android) Ejecuta el siguiente comando de Firebase CLI para subir tus símbolos:
firebase crashlytics:symbols:upload --app=<FIREBASE_APP_ID> <PATH/TO/SYMBOLS>
- Presiona el botón Log Strings and Crash Now y, luego, reinicia la app.
- Regresa al panel de Crashlytics y haz clic en el problema más reciente que aparece en la tabla Problemas. De nuevo, deberías ver algo similar a los problemas anteriores.
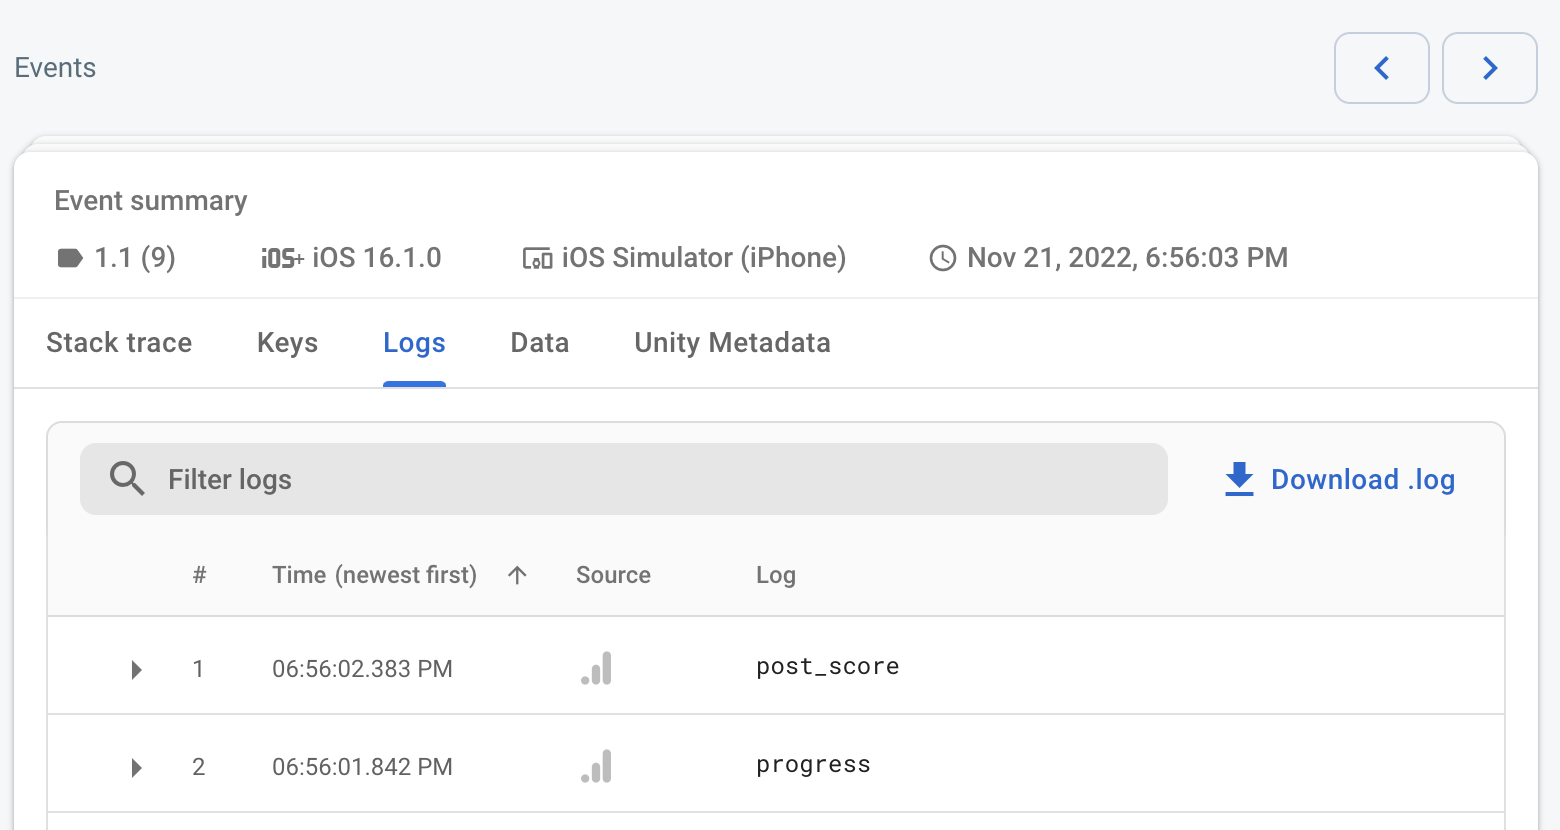
- Sin embargo, si haces clic en la pestaña Registros dentro de un Resumen del evento, obtendrás una vista como esta:
10. Cómo escribir y reemplazar una clave personalizada
Supongamos que deseas comprender mejor una falla que corresponde a variables establecidas en una pequeña cantidad de valores o configuraciones. Sería útil poder filtrar en función de la combinación de variables y los valores posibles que estás viendo en un momento determinado.
Además de registrar cadenas arbitrarias, Crashlytics ofrece otra forma de depuración cuando es beneficioso conocer el estado exacto de tu programa en el momento de la falla: las claves personalizadas.
Son pares clave-valor que puedes establecer para una sesión. A diferencia de los registros, que se acumulan y son puramente aditivos, las claves se pueden reemplazar para reflejar solo el estado más reciente de una variable o condición.
Además de ser un registro del último estado grabado de tu programa, estas claves se pueden usar como filtros potentes para los problemas de Crashlytics.
- En
Assets/Hamster/Scripts/States/DebugMenu.cs, sobrescribeSetAndOverwriteCustomKeyThenCrash()de la siguiente manera:void SetAndOverwriteCustomKeyThenCrash() { const string CURRENT_TIME_KEY = "Current Time"; System.TimeSpan currentTime = System.DateTime.Now.TimeOfDay; Crashlytics.SetCustomKey( CURRENT_TIME_KEY, DayDivision.GetPartOfDay(currentTime).ToString() // Values must be strings ); // Time Passes currentTime += DayDivision.DURATION_THAT_ENSURES_PHASE_CHANGE; Crashlytics.SetCustomKey( CURRENT_TIME_KEY, DayDivision.GetPartOfDay(currentTime).ToString() ); TestCrash(); } - Crea la app.
- (Solo para Android) Ejecuta el siguiente comando de Firebase CLI para subir tus símbolos:
firebase crashlytics:symbols:upload --app=<FIREBASE_APP_ID> <PATH/TO/SYMBOLS>
- Presiona el botón Set Custom Key and Crash y, luego, reinicia la app.
- Regresa al panel de Crashlytics y haz clic en el problema más reciente que aparece en la tabla Problemas. De nuevo, deberías ver algo similar a los problemas anteriores.
- Sin embargo, esta vez, haz clic en la pestaña Claves en el Resumen del evento para que puedas ver el valor de las claves, incluida
Current Time: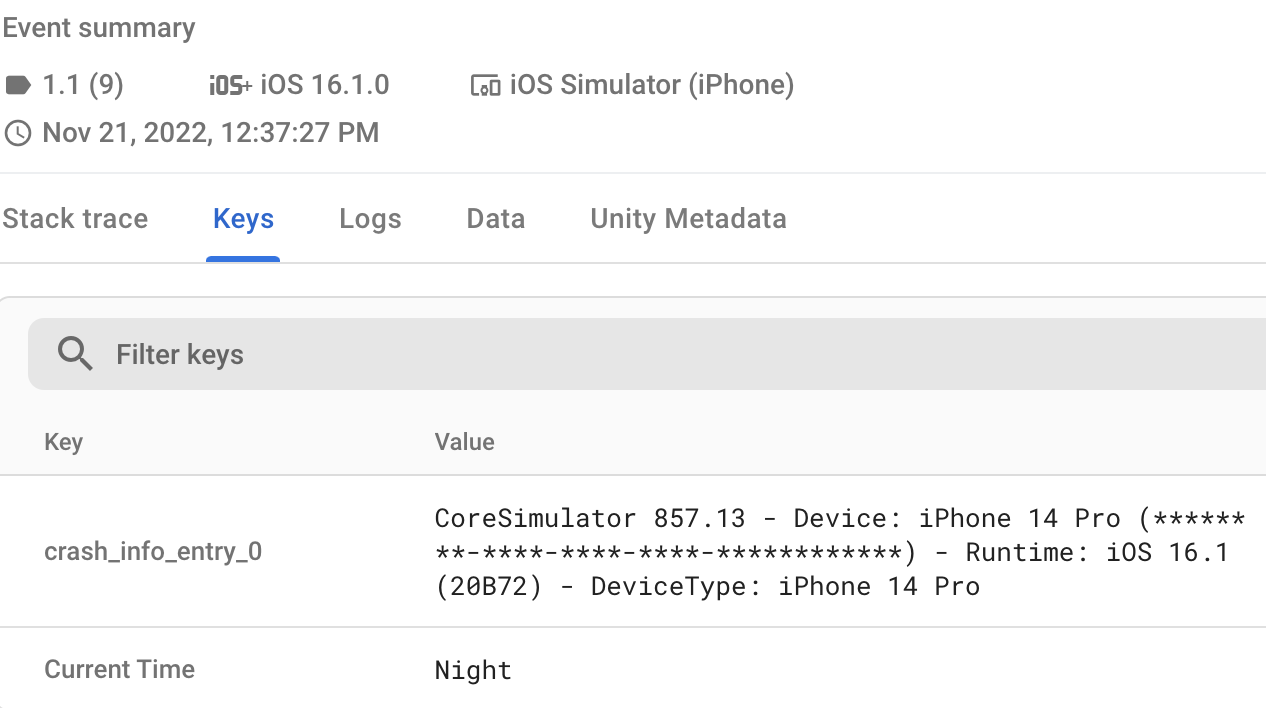
¿Por qué usarías claves personalizadas en lugar de registros personalizados?
- Los registros son buenos para almacenar datos secuenciales, pero las claves personalizadas son mejores si solo quieres el valor más reciente.
- En Firebase console, puedes filtrar fácilmente los problemas por los valores de las claves en el cuadro de búsqueda de la tabla Problemas.
Sin embargo, al igual que los registros, las claves personalizadas tienen un límite. Crashlytics admite un máximo de 64 pares clave-valor. Cuando alcances este límite, no se guardarán los valores adicionales. Cada par clave-valor puede tener un tamaño máximo de 1 KB.
11. (Solo para Android) Usa registros y claves personalizados para comprender y diagnosticar un error de ANR
Uno de los tipos de problemas más difíciles de depurar para los desarrolladores de Android es el error de Aplicación no responde (ANR). Los errores de ANR se producen cuando una app no responde a la entrada durante más de 5 segundos. Si esto sucede, significa que la app se bloqueó o está funcionando muy lentamente. Se muestra un diálogo a los usuarios, y estos pueden elegir entre "Esperar" o "Cerrar la app".
Los ANR son una mala experiencia del usuario y (como se menciona en el vínculo de ANR anterior) pueden afectar la visibilidad de tu app en Google Play Store. Debido a su complejidad y a que, a menudo, se deben a código de subprocesos múltiples con un comportamiento muy diferente en distintos modelos de teléfonos, reproducir los errores de ANR durante la depuración suele ser muy difícil, si no casi imposible. Por lo tanto, el mejor enfoque suele ser abordarlos de forma analítica y deductiva.
En este método, usaremos una combinación de Crashlytics.LogException, Crashlytics.Log y Crashlytics.SetCustomKey para complementar el registro automático de problemas y obtener más información.
- En
Assets/Hamster/Scripts/States/DebugMenu.cs, sobrescribeSetLogsAndKeysBeforeANR()de la siguiente manera:void SetLogsAndKeysBeforeANR() { System.Action<string,long> WaitAndRecord = (string methodName, long targetCallLength)=> { System.Diagnostics.Stopwatch stopWatch = new System.Diagnostics.Stopwatch(); const string CURRENT_FUNCTION = "Current Async Function"; // Initialize key and start timing Crashlytics.SetCustomKey(CURRENT_FUNCTION, methodName); stopWatch.Start(); // The actual (simulated) work being timed. BusyWaitSimulator.WaitOnSimulatedBlockingWork(targetCallLength); // Stop timing stopWatch.Stop(); if(stopWatch.ElapsedMilliseconds>=BusyWaitSimulator.EXTREME_DURATION_MILLIS) { Crashlytics.Log($"'{methodName}' is long enough to cause an ANR."); } else if(stopWatch.ElapsedMilliseconds>=BusyWaitSimulator.SEVERE_DURATION_MILLIS) { Crashlytics.Log($"'{methodName}' is long enough it may cause an ANR"); } }; WaitAndRecord("DoSafeWork",1000L); WaitAndRecord("DoSevereWork",BusyWaitSimulator.SEVERE_DURATION_MILLIS); WaitAndRecord("DoExtremeWork",2*BusyWaitSimulator.EXTREME_DURATION_MILLIS); } - Crea la app.
- Ejecuta el siguiente comando de Firebase CLI para subir tus símbolos:
firebase crashlytics:symbols:upload --app=<FIREBASE_APP_ID> <PATH/TO/SYMBOLS>
- Presiona el botón etiquetado como Set Logs And Keys → ANR y, luego, reinicia la app.
- Vuelve al panel de Crashlytics y, luego, haz clic en el problema nuevo en la tabla Problemas para ver el Resumen del evento. Si la llamada se realizó correctamente, deberías ver algo como lo siguiente:
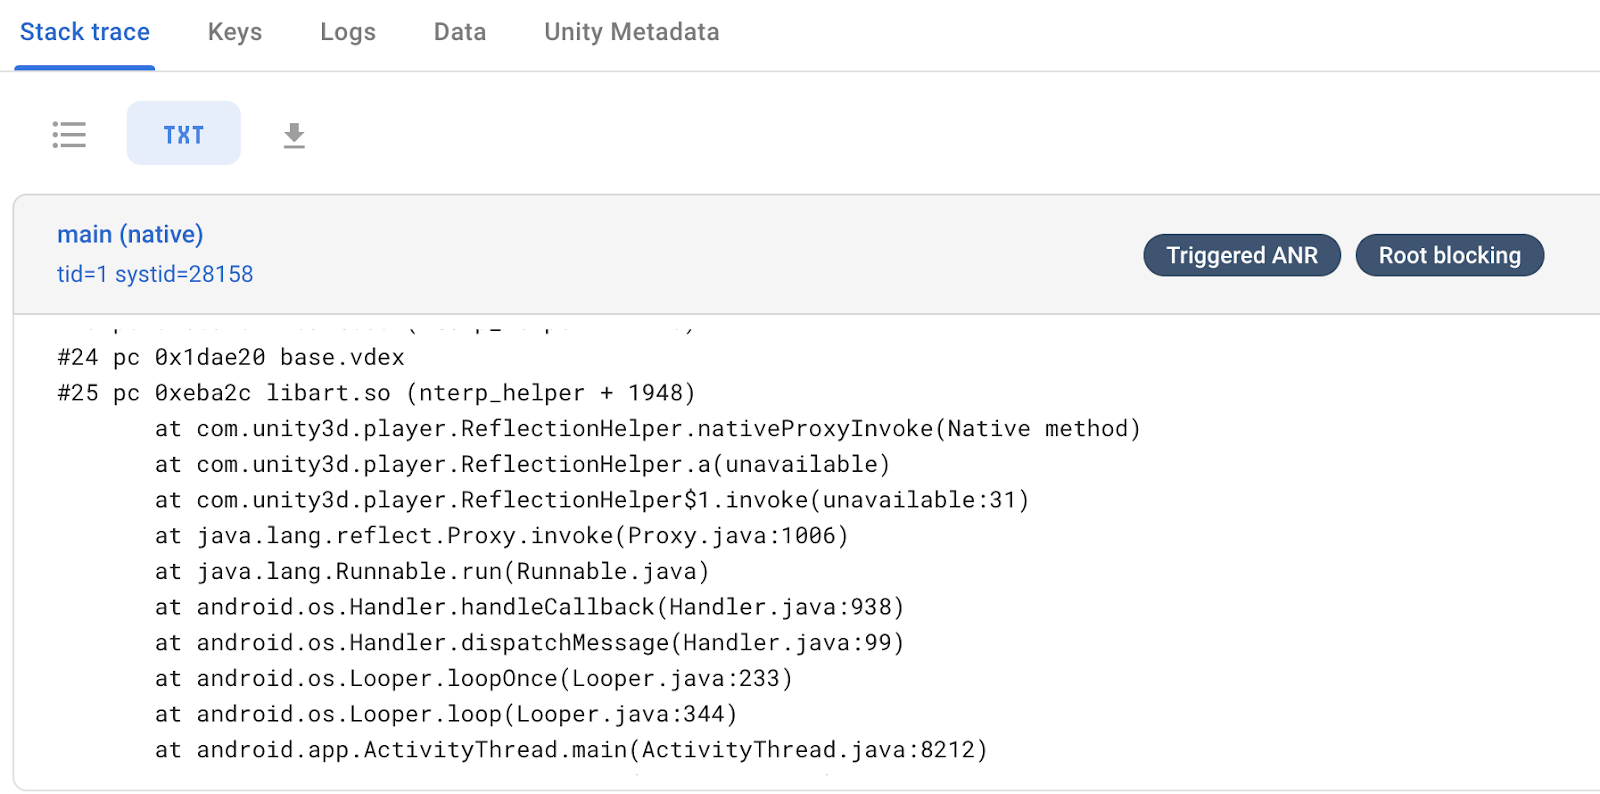
Como puedes ver, Firebase identificó la espera activa en el subproceso como el motivo principal por el que tu app activó un error de ANR. - Si observas los registros en la pestaña Registros del Resumen del evento, verás que el último método registrado como completo es
DoSevereWork.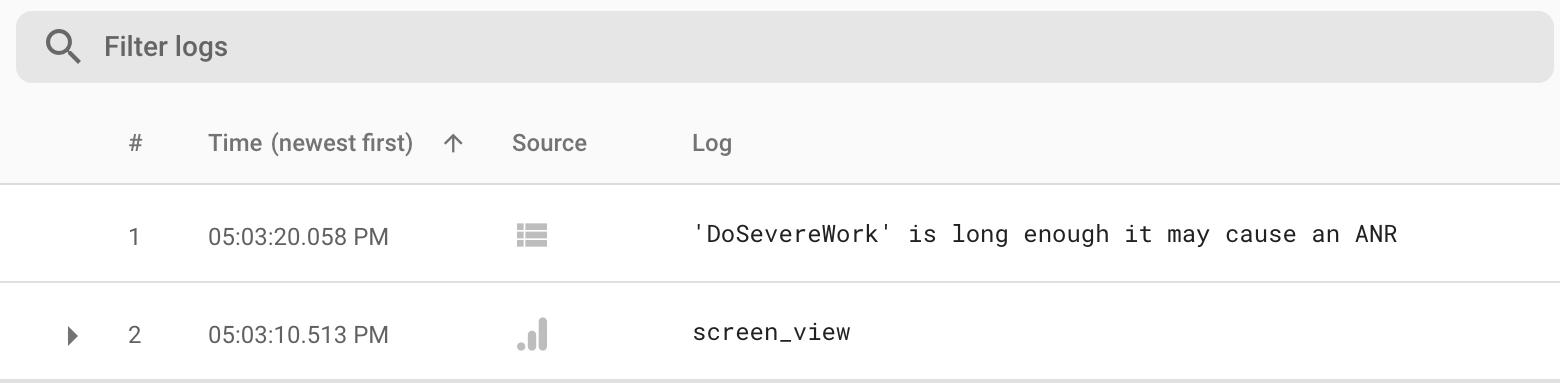
En cambio, el último método que se indica como iniciado esDoExtremeWork, lo que indica que el ANR ocurrió durante este método y que el juego se cerró antes de que pudiera registrarDoExtremeWork.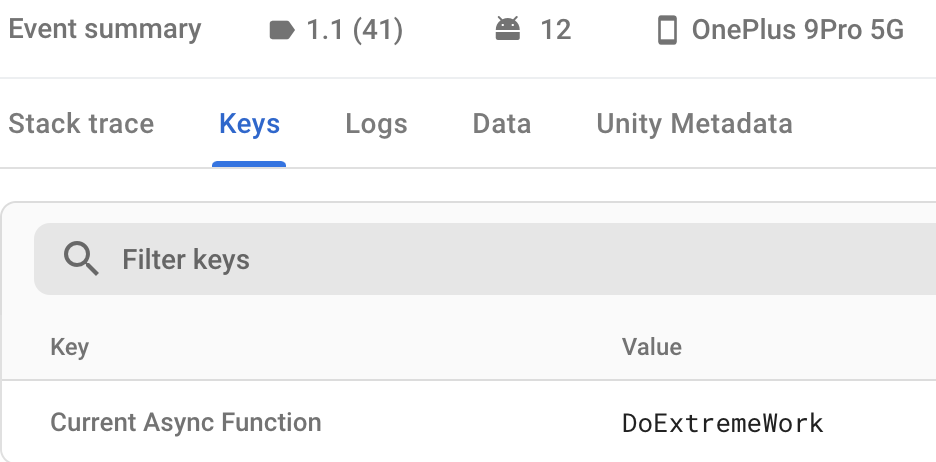
¿Por qué hacerlo?
- Reproducir los errores de ANR es increíblemente difícil, por lo que poder obtener información detallada sobre el área del código y las métricas es muy importante para descubrirlos de forma deductiva.
- Con la información almacenada en las claves personalizadas, ahora sabes qué subproceso asíncrono tardó más en ejecutarse y cuáles estaban en riesgo de activar errores de ANR. Este tipo de datos lógicos y numéricos relacionados te mostrarán en qué parte de tu código es más necesario realizar optimizaciones.
12. Intercalar eventos de Analytics para enriquecer aún más los informes
Los siguientes métodos también se pueden llamar desde el menú de depuración, pero, en lugar de generar problemas por sí mismos, usan Google Analytics como otra fuente de información para comprender mejor el funcionamiento de tu juego.
A diferencia de los otros métodos que escribiste en este codelab, debes usar estos métodos en combinación con los demás. Llama a estos métodos (presionando el botón correspondiente en el menú de depuración) en el orden arbitrario que desees antes de ejecutar uno de los otros. Luego, cuando examines la información del problema específico de Crashlytics, verás un registro ordenado de los eventos de Analytics. Estos datos se pueden usar en un juego para comprender mejor una combinación del flujo del programa o la entrada del usuario, según cómo hayas instrumentado tu app.
- En
Assets/Hamster/Scripts/States/DebugMenu.cs, reemplaza las implementaciones existentes de los siguientes métodos:public void LogProgressEventWithStringLiterals() { Firebase.Analytics.FirebaseAnalytics.LogEvent("progress", "percent", 0.4f); }public void LogIntScoreWithBuiltInEventAndParams() { Firebase.Analytics.FirebaseAnalytics .LogEvent( Firebase.Analytics.FirebaseAnalytics.EventPostScore, Firebase.Analytics.FirebaseAnalytics.ParameterScore, 42 ); } - Compila e implementa tu juego y, luego, ingresa al Menú de depuración.
- (Solo para Android) Ejecuta el siguiente comando de Firebase CLI para subir tus símbolos:
firebase crashlytics:symbols:upload --app=<FIREBASE_APP_ID> <PATH/TO/SYMBOLS>
- Presiona al menos uno de los siguientes botones una o más veces para llamar a las funciones anteriores:
- Log String Event
- Log Int Event
- Presiona el botón Crash Now.
- Reinicia el juego para que suba el evento de falla a Firebase.
- Cuando registras varias secuencias arbitrarias de eventos de Analytics y, luego, tu juego genera un evento a partir del cual Crashlytics crea un informe (como acabas de hacer), se agregan a la pestaña Registros del Resumen de eventos de Crashlytics de la siguiente manera:
13. De cara al futuro
Con esto, deberías tener una mejor base teórica para complementar tus informes de fallas generados automáticamente. Esta nueva información te permite usar el estado actual, los registros de eventos pasados y los eventos existentes de Google Analytics para desglosar mejor la secuencia de eventos y la lógica que llevaron a su resultado.
Si tu app está segmentada para Android 11 (nivel de API 30) o versiones posteriores, considera incorporar GWP-ASan, una función de asignación de memoria nativa útil para depurar fallas causadas por errores de memoria nativa, como errores de use-after-free y heap-buffer-overflow. Para aprovechar esta función de depuración, habilita GWP-ASan de forma explícita.
Próximos pasos
Continúa con el codelab Incorpora Remote Config en tu juego de Unity, en el que aprenderás a usar Remote Config y A/B Testing en Unity.