1. Introduction
In this codelab, you'll learn how to use advanced features of Crashlytics which will give you better visibility into crashes and the circumstances that might have caused them.
You will add new functionality to a sample game, MechaHamster: Level Up with Firebase Edition. This sample game is a new version of the classic Firebase game MechaHamster that removes most of its built-in Firebase functionality, giving you the chance to implement new uses of Firebase in their place.
You'll add a debug menu to the game. This debug menu calls methods that you'll make and allows you to exercise the different functionalities of Crashlytics. These methods will show you how to annotate your automatic crash reports with custom keys, custom logs, nonfatal errors, and more.
After building out the game, you will use the debug menu, and inspect the results to understand the unique view that they provide into how your game runs in the wild.
What you'll learn
- The types of errors that are automatically caught by Crashlytics.
- Additional errors that can be purposefully recorded.
- How to add more information to these errors to make them easier to understand.
What you'll need
- Unity (Minimum Recommended Version 2019+) with one or both of the following:
- iOS Build Support
- Android Build Support
- (For Android Only) The Firebase CLI (used to upload symbols for crash reports)
- Follow the instructions to install the Firebase CLI.
If you've already installed the CLI, make sure to update to its latest version.
- Follow the instructions to install the Firebase CLI.
2. Set up your development environment
The following sections describe how to download the Level Up with Firebase code and open it in Unity.
Note that this Level Up with Firebase sample game is used by several other Firebase + Unity codelabs, so you might have already completed the tasks in this section. If so, you can go directly to the last step on this page: "Add Firebase SDKs for Unity".
Download the code
Clone this codelab's GitHub repository from the command line:
git clone https://github.com/firebase/level-up-with-firebase.git
Alternatively, if you do not have git installed, you can download the repository as a ZIP file.
Open Level Up with Firebase in the Unity editor
- Launch the Unity Hub and, from the Projects tab, click the dropdown arrow next to Open.
- Click Add project from disk.
- Navigate to the directory that contains the code, and then click OK.
- If prompted, select a Unity editor version to use and your target platform (Android or iOS).
- Click on the project name, level-up-with-firebase, and the project will open in the Unity editor.
- If your editor does not automatically open it, open
MainGameScenein Assets > Hamster in the Project tab of the Unity Editor.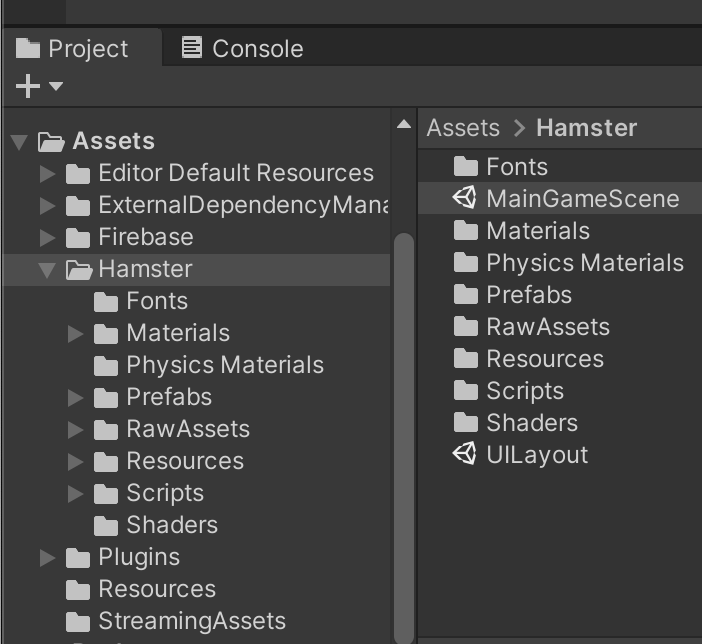
For more information about installing and using Unity, see Working in Unity.
3. Add Firebase to your Unity project
Create a Firebase project
- Sign into the Firebase console using your Google Account.
- Click the button to create a new project, and then enter a project name (for example,
Mechahamster Codelab).
- Click Continue.
- If prompted, review and accept the Firebase terms, and then click Continue.
- (Optional) Enable AI assistance in the Firebase console (called "Gemini in Firebase").
- For this codelab, you need Google Analytics to optimally use Firebase products, so keep the toggle on for the Google Analytics option. Follow the on-screen instructions to set up Google Analytics.
- Click Create project, wait for your project to provision, and then click Continue.
Register your app with Firebase
- Still in the Firebase console, from the center of the project overview page, click the Unity icon to launch the setup workflow or, if you've already added an app to your Firebase project, click Add app to display the platform options.
- Select to register both the Apple (iOS) and Android build targets.
- Enter your Unity project's platform-specific ID(s). For this codelab, enter the following:
- For Apple (iOS): Enter
com.google.firebase.level-upin the iOS bundle ID field. - For Android: Enter
com.google.firebase.level_upin the Android package name field.
- For Apple (iOS): Enter
- (Optional) Enter your Unity project's platform-specific nickname(s).
- Click Register app, and then proceed to the Download config file section.
Add Firebase configuration files
After clicking Register app, you'll be prompted to download two configuration files (one config file for each build target). Your Unity project needs the Firebase metadata in these files to connect with Firebase.
- Download both available config files:
- For Apple (iOS): Download GoogleService-Info.plist.
- For Android: Download google-services.json.
- Open the Project window of your Unity project, then move both config files into the Assets folder.
- Back in the Firebase console, in the setup workflow, click Next and proceed to Add Firebase SDKs for Unity.
Add Firebase SDKs for Unity
- Click Download Firebase Unity SDK in the Firebase console.
- Unzip the SDK somewhere convenient.
- In your open Unity Project, navigate to Assets > Import Package > Custom Package.
- In the Import package dialog, navigate to the directory that contains the unzipped SDK, select
FirebaseAnalytics.unitypackage, and then click Open. - From the Import Unity Package dialog that appears, click Import.
- Repeat the previous steps to import
FirebaseCrashlytics.unitypackage. - Return to the Firebase console and, in the setup workflow, click Next.
For more information about adding Firebase SDKs to Unity projects, see Additional Unity installation options.
4. Set up Crashlytics in your Unity project
To use Crashlytics in Unity projects, you'll need to do a few more setup steps. Of course, you'll need to initialize the SDK. But also, you'll need to upload your symbols so that you can see symbolicated stacktraces in the Firebase console, and you'll need to force a test crash to make sure that Firebase is getting your crash events.
Initialize the Crashlytics SDK
- In
Assets/Hamster/Scripts/MainGame.cs, add the followingusingstatements:using Firebase.Crashlytics; using Firebase.Extensions;usingstatements the following code will not work. - Still in
MainGame.cs, add Firebase initialization to the existingStart()method by callingInitializeFirebaseAndStartGame():void Start() { Screen.SetResolution(Screen.width / 2, Screen.height / 2, true); InitializeFirebaseAndStartGame(); } - And again, in
MainGame.cs, findInitializeFirebaseAndStartGame(), declare an app variable, and then overwrite the method's implementation like so:public Firebase.FirebaseApp app = null; // Begins the firebase initialization process and afterwards, opens the main menu. private void InitializeFirebaseAndStartGame() { Firebase.FirebaseApp.CheckAndFixDependenciesAsync() .ContinueWithOnMainThread( previousTask => { var dependencyStatus = previousTask.Result; if (dependencyStatus == Firebase.DependencyStatus.Available) { // Create and hold a reference to your FirebaseApp, app = Firebase.FirebaseApp.DefaultInstance; // Set the recommended Crashlytics uncaught exception behavior. Crashlytics.ReportUncaughtExceptionsAsFatal = true; InitializeCommonDataAndStartGame(); } else { UnityEngine.Debug.LogError( $"Could not resolve all Firebase dependencies: {dependencyStatus}\n" + "Firebase Unity SDK is not safe to use here"); } }); }
Placing the initialization logic here prevents player interaction before the Firebase dependencies are initialized.
The benefits and effects of reporting unhandled exceptions as fatal are discussed in the Crashlytics FAQ.
Build your project and upload symbols
The steps for building and uploading symbols are different for iOS and Android apps.
iOS+ (Apple platform)
- From the Build Settings dialog, export your project to an Xcode workspace.
- Build your app.
For Apple platforms, the Firebase Unity Editor plugin automatically configures your Xcode project to generate and upload a Crashlytics-compatible symbol file to Firebase servers for each build. This symbols information is required to see symbolicated stack traces in the Crashlytics dashboard.
Android
- (only during initial setup, not for each build) Set up your build:
- Create a new folder called Builds at the root of your project directory (i.e., as a sibling to your Assets directory), and then create a sub-folder called Android.
- In File > Build Settings > Player Settings > Configuration, set Scripting Backend to IL2CPP.
- IL2CPP generally causes builds to be smaller and have better performance.
- IL2CPP is also the ONLY available option on iOS and selecting it here allows the two platforms to be in better parity and make debugging differences between the two (if you choose to build both) simpler.
- Build your app. In File > Build Settings, complete the following:
- Make sure the Create symbols.zip is checked (or if presented with a dropdown, select Debugging).
- Build your APK directly from the Unity Editor into the Builds/Android sub-folder that you just made.
- Once your build has finished, you need to generate a Crashlytics-compatible symbol file and upload it to Firebase servers. This symbols information is required to see symbolicated stack traces for native library crashes in the Crashlytics dashboard.
Generate and upload this symbols file by running the following Firebase CLI command:firebase crashlytics:symbols:upload --app=<FIREBASE_APP_ID> <PATH/TO/SYMBOLS>
FIREBASE_APP_ID: Your Firebase Android App ID (not your package name). Find this value in thegoogle-services.jsonfile that you downloaded earlier. It's themobilesdk_app_idvalue.
Example Firebase Android App ID:1:567383003300:android:17104a2ced0c9b9bPATH/TO/SYMBOLS: the path of the zipped symbol file generated in the Builds/Android directory when your build finished (for example:Builds/Android/myapp-1.0-v100.symbols.zip).
Force a test crash to finish setup
To finish setting up Crashlytics and see initial data in the Crashlytics dashboard of the Firebase console, you need to force a test crash.
- In the MainGameScene find the EmptyObject
GameObjectin the editor Hierarchy, add the following script to it and then save the scene. This script will cause a test crash a few seconds after you run your app.using System; using UnityEngine; public class CrashlyticsTester : MonoBehaviour { // Update is called once per frame void Update() { // Tests your Crashlytics implementation by // throwing an exception every 60 frames. // You should see reports in the Firebase console // a few minutes after running your app with this method. if(Time.frameCount >0 && (Time.frameCount%60) == 0) { throw new System.Exception("Test exception; please ignore"); } } } - Build your app and upload symbol information after your build finishes.
- iOS: The Firebase Unity Editor plugin automatically configures your Xcode project to upload your symbol file.
- Android: Run the Firebase CLI
crashlytics:symbols:uploadcommand to upload your symbol file.
- Run your app. Once your app is running, watch the device log and wait for the exception to trigger from the
CrashlyticsTester.- iOS: View logs in the bottom pane of Xcode.
- Android: View logs by running the following command in the terminal:
adb logcat.
- Visit the Crashlytics dashboard to view the exception! You'll see it in the Issues table at the bottom of the dashboard. Later in the codelab, you'll learn more about how to explore these reports.
- Once you've confirmed the event was uploaded to Crashlytics, select the EmptyObject
GameObjectyou attached it to, remove only theCrashlyticsTestercomponent, and then save the scene to restore it to its original condition.
5. Enable and understand the Debug Menu
So far, you've added Crashlytics to your Unity project, finished setup, and confirmed that the Crashlytics SDK is uploading events to Firebase. You'll now create a menu in your Unity project which will demonstrate how to use more advanced Crashlytics functionality in your game. The Level Up with Firebase Unity project already has a hidden Debug Menu that you'll make visible and write the functionality for.
Enable the Debug Menu
The button to access the Debug Menu exists in your Unity project, but it's not currently enabled. You must enable the button to access it from the MainMenu prefab:
- In the Unity Editor, open the prefab named
MainMenu.
- In the prefab hierarchy, find the disabled sub-object named
DebugMenuButton, and then select it.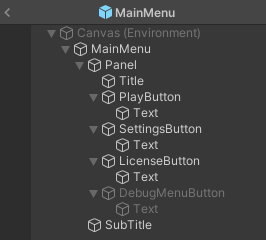
- Enable the
DebugMenuButtonby checking the box in the upper-left corner to the left of the text field containingDebugMenuButton.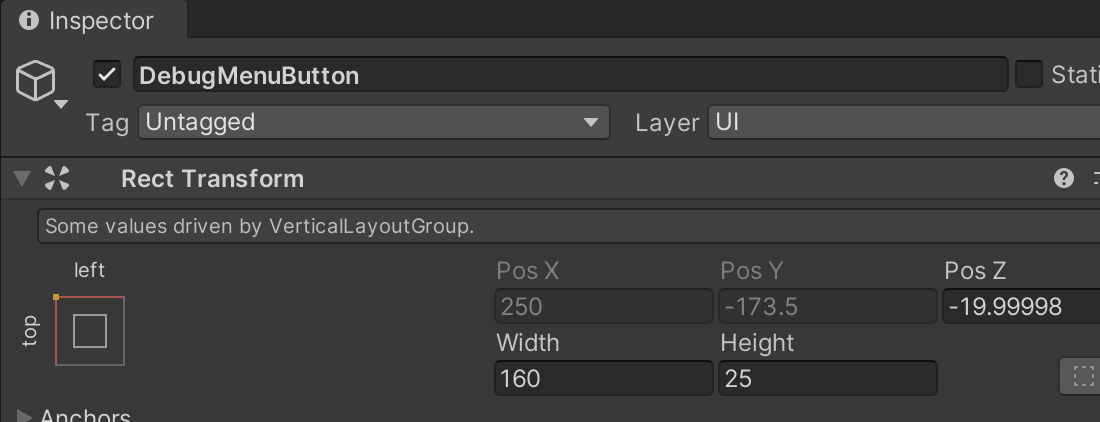
- Save the prefab.
- Run the game in either the editor or on your device. The menu should now be accessible.
Preview and understand the method bodies for the Debug Menu
Later in this codelab, you'll write method bodies for some preconfigured debug Crashlytics methods. In the Level Up with Firebase Unity project, though, the methods are defined in and called from DebugMenu.cs.
While some of these methods will both call Crashlytics methods and throw errors, the ability of Crashlytics to catch these errors does not depend on calling those methods first. Rather, the crash reports generated from automatically catching errors will be enhanced by the information added by these methods.
Open DebugMenu.cs, and then find the following methods:
Methods for generating and annotating Crashlytics issues:
CrashNowLogNonfatalErrorLogStringsAndCrashNowSetAndOverwriteCustomKeyThenCrashSetLogsAndKeysBeforeANR
Methods for logging Analytics events to aid in debugging:
LogProgressEventWithStringLiteralsLogIntScoreWithBuiltInEventAndParams
In later steps of this codelab, you will implement these methods and learn how they help address specific situations that can occur in game development.
6. Ensure delivery of crash reports in development
Before you start to implement these debug methods and see how they affect crash reports, make sure you understand how events are reported to Crashlytics.
For Unity projects, crash and exception events in your game are immediately written to disk. For uncaught exceptions that don't crash your game (for example, uncaught C# exceptions in game logic), you can have the Crashlytics SDK report them as fatal events by setting the Crashlytics.ReportUncaughtExceptionsAsFatal property to true where you initialize Crashlytics in your Unity project. These events are reported to Crashlytics in real-time without the need for an end-user to restart the game. Note that native crashes are always reported as fatal events and sent along when an end-user restarts the game.
In addition, be aware of the following small—but significant—differences between how the different runtime environments send Crashlytics information to Firebase:
iOS simulator:
- Crashlytics information is reported if and only if you detach Xcode from the simulator. If Xcode is attached, it catches the errors upstream, preventing information delivery.
Mobile physical devices (Android and iOS):
- Android-specific: ANRs are only reported on Android 11+. ANRs and non-fatal events are reported on the next run.
Unity Editor:
- Crashlytics information from the editor in play mode or in standalone DO NOT get recorded or uploaded to Firebase. Furthermore, the Firebase Desktop development workflow does not support Crashlytics.
Test crashing your game at the touch of a button in CrashNow()
After Crashlytics is set up in your game, the Crashlytics SDK automatically records crashes and uncaught exceptions and uploads them to Firebase for analysis. And the reports are displayed in the Crashlytics dashboard in the Firebase console.
- To demonstrate that this is indeed automatic: open
DebugMenu.cs, and then overwrite the methodCrashNow()as follows:void CrashNow() { TestCrash(); } - Build your app.
- (Android Only) Upload your symbols by running the following Firebase CLI command:
firebase crashlytics:symbols:upload --app=<FIREBASE_APP_ID> <PATH/TO/SYMBOLS>
- Tap the Crash Now button, and proceed to the next step of this codelab to find out how to view and interpret the crash report.
7. Understand issue reports in the Firebase console
When it comes to viewing your crash reports, there's a little bit more you need to know about how to get the most out of them. Each of the methods you write will show how to add different types of information to Crashlytics reports.
- Tap the Crash Now button, and then restart your app.
- Go to the Crashlytics dashboard. Scroll down to the Issues table at the bottom of the dashboard where Crashlytics groups events that all have the same root cause into "issues".
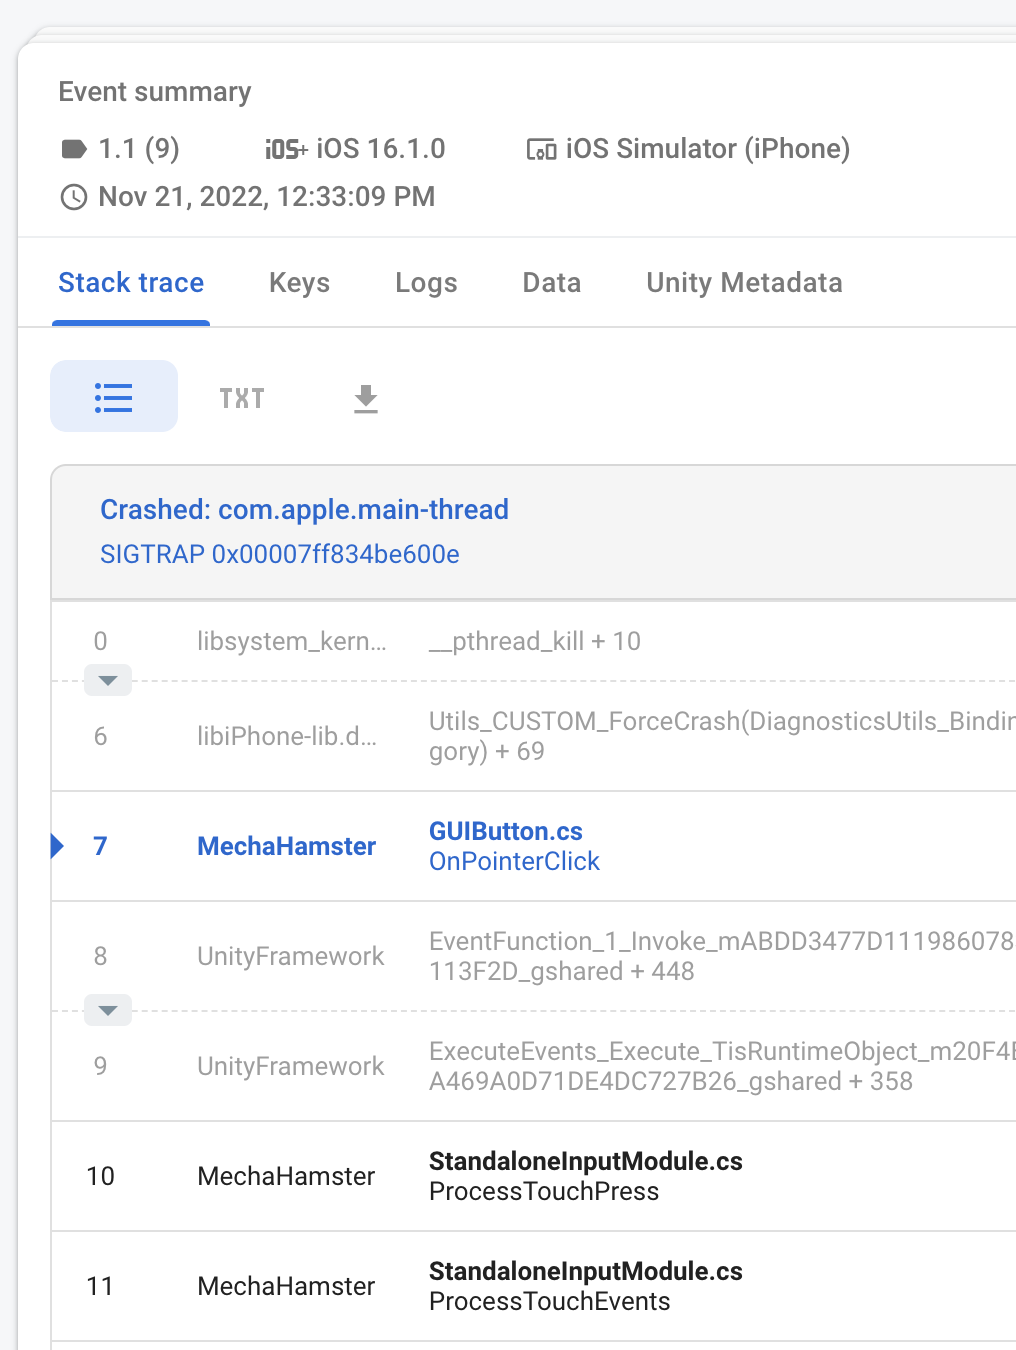
- Click on the new issue that's listed in the Issues table. Doing this displays the Event summary about each individual event that was sent to Firebase.
You should see something like the following screencap. Notice how the Event summary prominently features the stack trace of the call that led to the crash.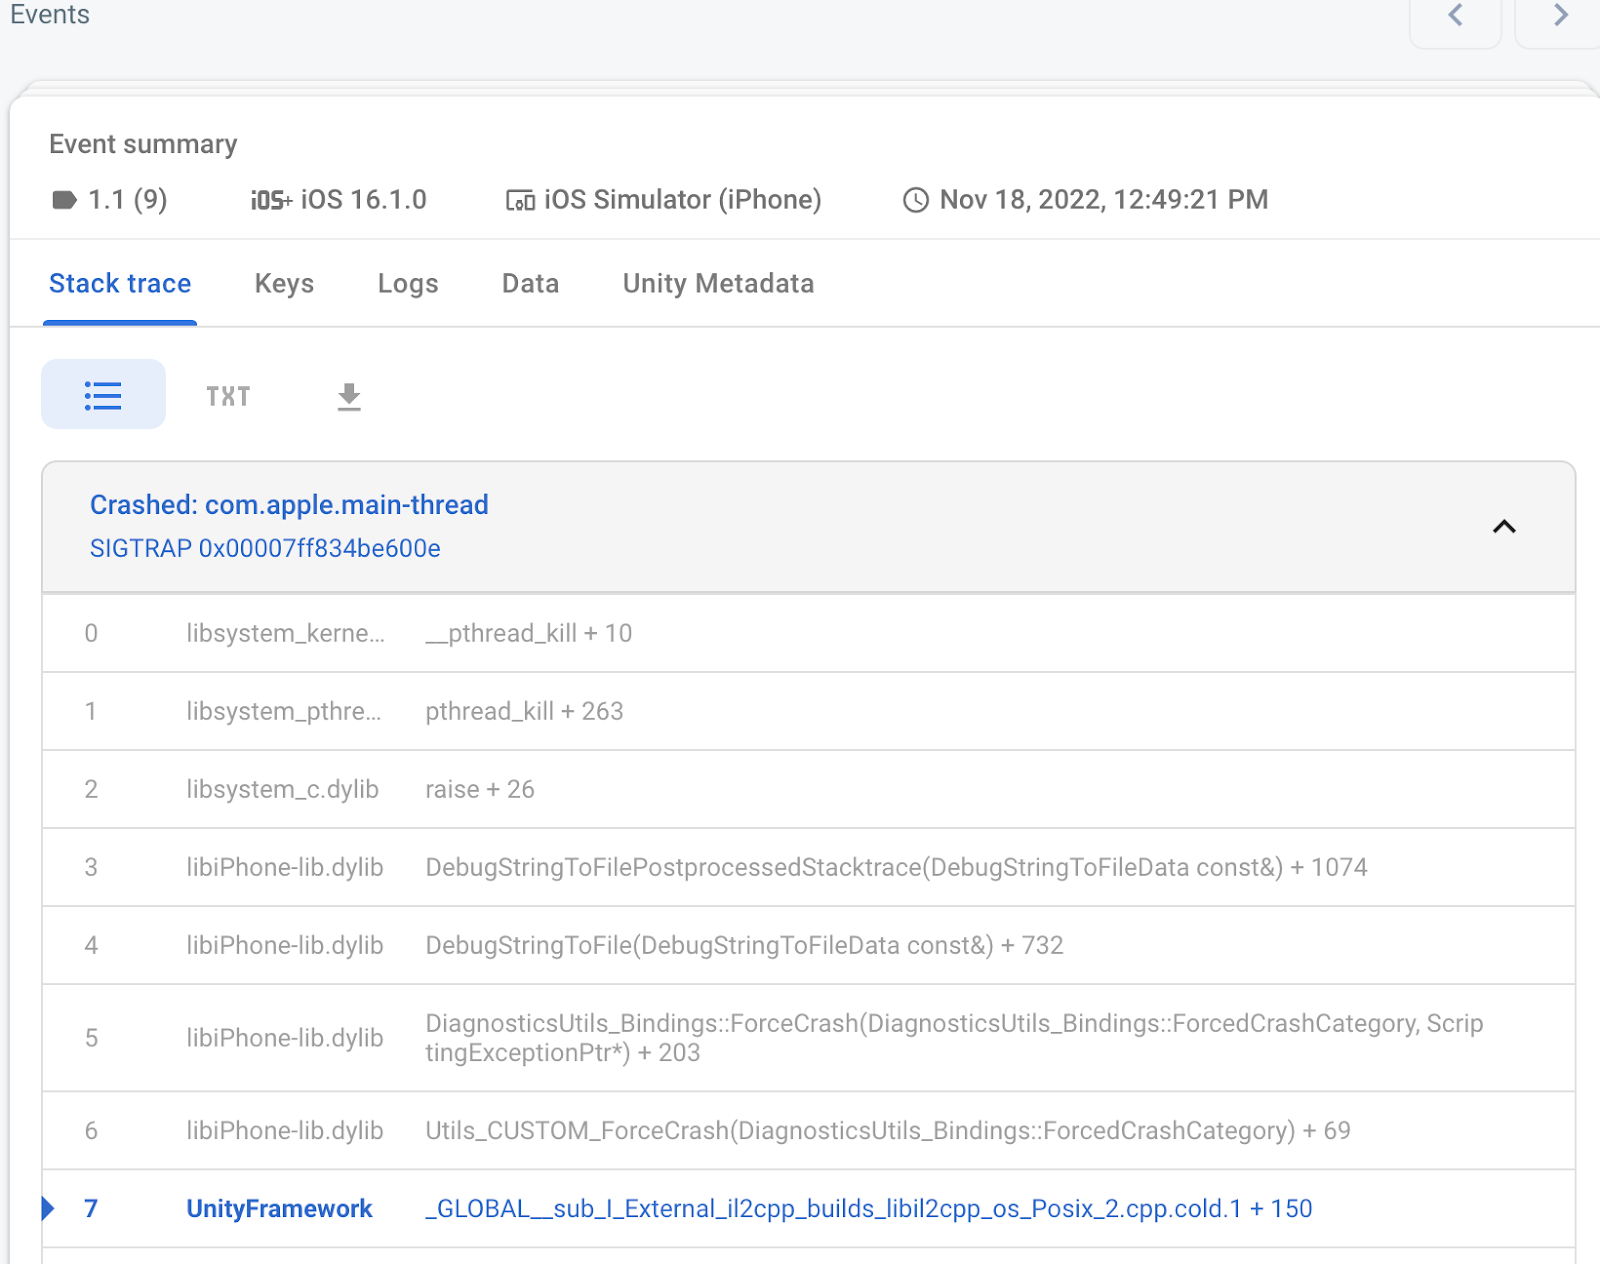
Additional metadata
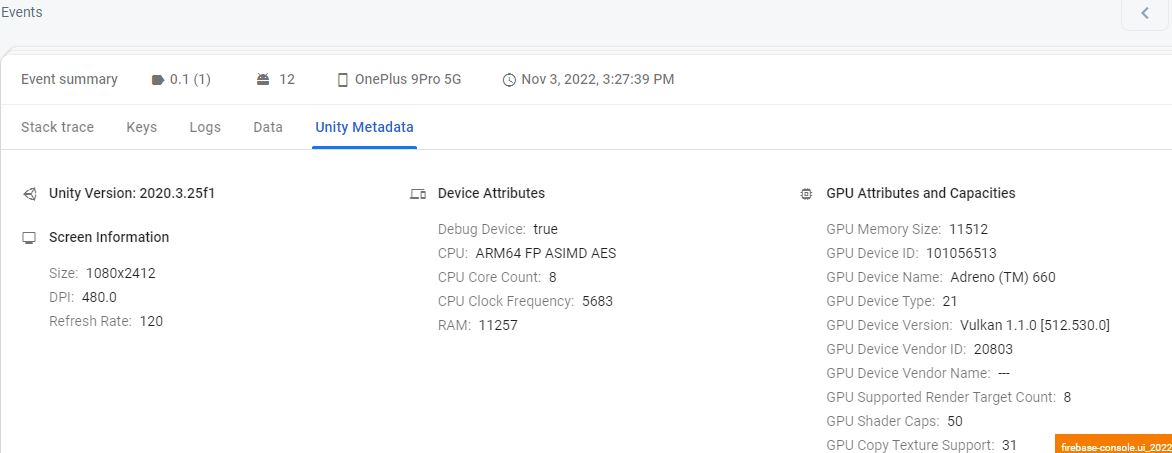
Another helpful tab is the Unity Metadata tab. This section informs you about the attributes of the device on which the event occurred, including physical features, the CPU model/specs, and all sorts of GPU metrics.
Here's an example where the information in this tab might be useful:
Imagine your game makes heavy use of shaders to achieve a certain look, but not all phones have GPUs that are capable of rendering this feature. The information in the Unity Metadata tab can give you a better idea of what hardware your app should test for when deciding what features to automatically make available or disable entirely.
While a bug or crash may never happen on your device, due to the massive diversity of Android devices in the wild, it helps to better understand the particular "hotspots" of your audience's devices.
8. Throw, catch, and log an exception
Oftentimes, as a developer, even if your code properly catches and handles a runtime exception, it's good to note that it occurred, and under what circumstances. Crashlytics.LogException can be used for this exact purpose—to send an exception event to Firebase so that you can further debug the issue in the Firebase console.
- In
Assets/Hamster/Scripts/States/DebugMenu.cs, append the following to theusingstatements:// Import Firebase using Firebase.Crashlytics; - Still in
DebugMenu.cs, overwriteLogNonfatalError()as follows:void LogNonfatalError() { try { throw new System.Exception($"Test exception thrown in {nameof(LogNonfatalError)}"); } catch(System.Exception exception) { Crashlytics.LogException(exception); } } - Build your app.
- (Android Only) Upload your symbols by running the following Firebase CLI command:
firebase crashlytics:symbols:upload --app=<FIREBASE_APP_ID> <PATH/TO/SYMBOLS>
- Tap the Log Nonfatal Error button, and then restart your app.
- Go to the Crashlytics dashboard, and you should see something similar to what you saw in the last step of this codelab.
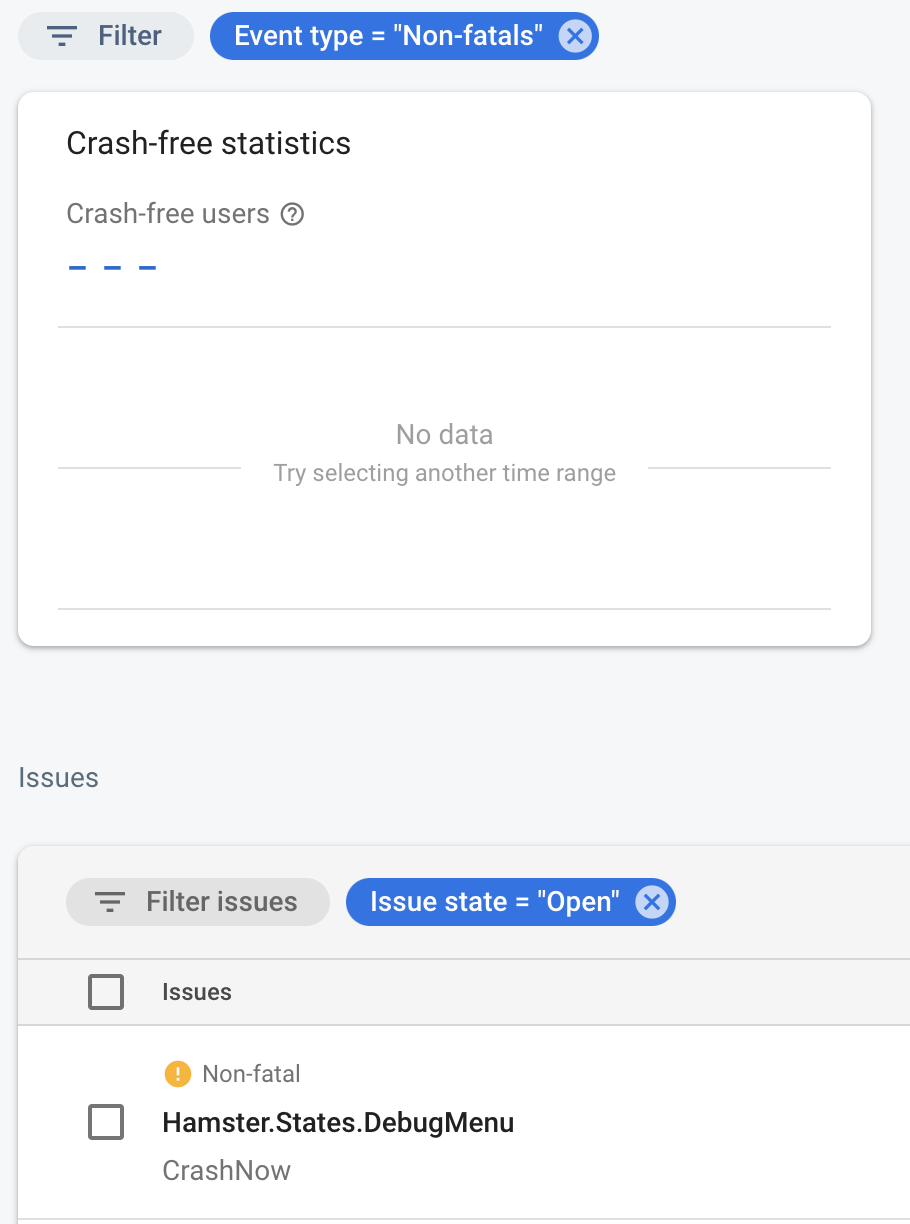
- This time, though, restrict the Event type filter to Non-fatals so that you're only viewing non-fatal errors, such as the one you just logged.
9. Log strings to Crashlytics to better understand the flow of program execution
Have you ever tried to figure out why a line of code that gets called from multiple paths, hundreds if not thousands of times per session, can suddenly generate an exception or crash? While it might be nice to step through the code in an IDE and look at the values more closely, what if this happens only among a vanishingly small percentage of your users? Even worse, what would you do if you can't replicate this crash no matter what you do?
In situations like this, having some context can make a world of difference. With Crashlytics.Log, you have the ability to write out the context you need. Think of these messages as hints to your future self about what might be going on.
While logs can be used in myriad ways, they are typically most helpful for recording situations where the order and/or absence of calls is a vitally important piece of information.
- In
Assets/Hamster/Scripts/States/DebugMenu.cs, overwriteLogStringsAndCrashNow()as follows:void LogStringsAndCrashNow() { Crashlytics.Log($"This is the first of two descriptive strings in {nameof(LogStringsAndCrashNow)}"); const bool RUN_OPTIONAL_PATH = false; if(RUN_OPTIONAL_PATH) { Crashlytics.Log(" As it stands, this log should not appear in your records because it will never be called."); } else { Crashlytics.Log(" A log that will simply inform you which path of logic was taken. Akin to print debugging."); } Crashlytics.Log($"This is the second of two descriptive strings in {nameof(LogStringsAndCrashNow)}"); TestCrash(); } - Build your app.
- (Android Only) Upload your symbols by running the following Firebase CLI command:
firebase crashlytics:symbols:upload --app=<FIREBASE_APP_ID> <PATH/TO/SYMBOLS>
- Tap the Log Strings and Crash Now button, and then restart your app.
- Go back to the Crashlytics dashboard, and click into the newest issue listed in the Issues table. Again you should see something similar to the previous issues.
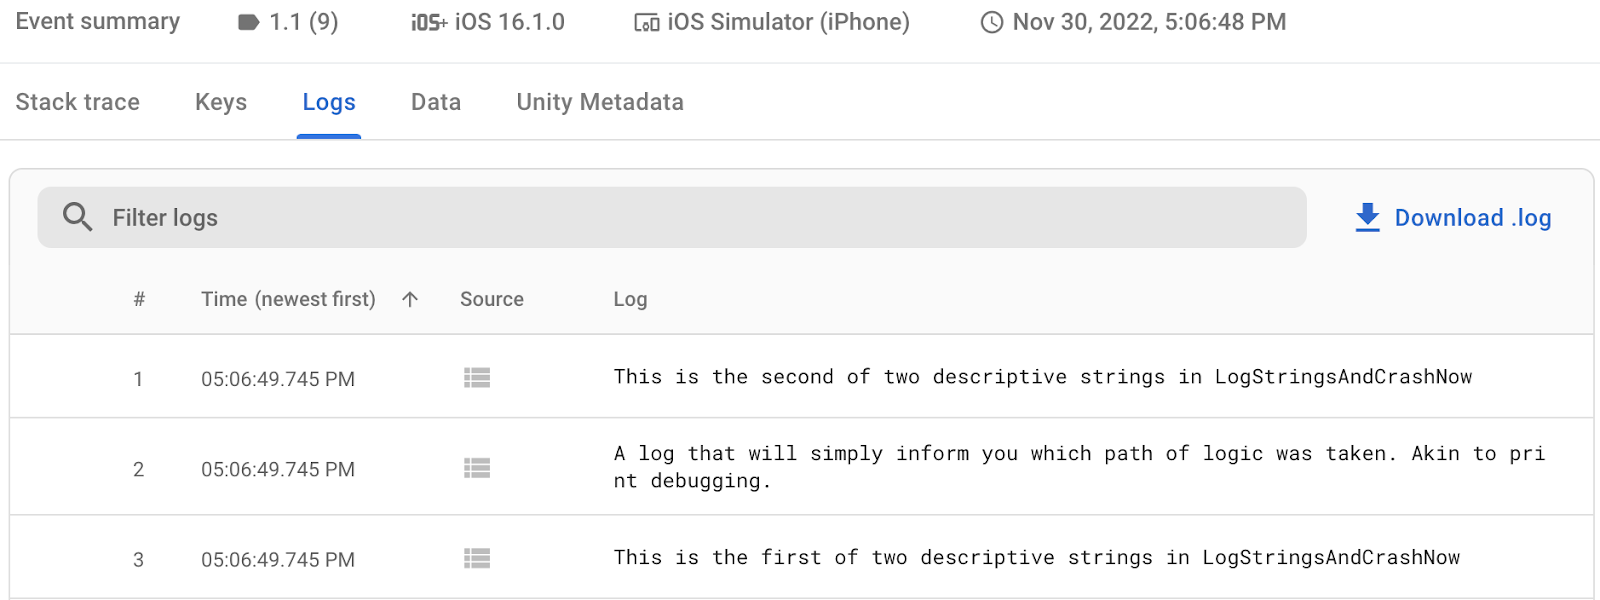
- However, if you click the Logs tab within an Event summary, you get a view like this:
10. Write and overwrite a custom key
Let's say you want to better understand a crash corresponding to variables set to a small number of values or configurations. It might be nice to be able to filter, based on the combination of variables and possible values you are looking at, at any given time.
On top of logging arbitrary strings, Crashlytics offers another form of debugging when it is beneficial to know the exact state of your program as it crashed: custom keys.
These are key-value pairs that you can set for a session. Unlike logs which accumulate and are purely additive, keys can be overwritten to only reflect the most recent status of a variable or condition.
In addition to being a ledger of the last recorded state of your program, these keys can then be used as powerful filters for Crashlytics issues.
- In
Assets/Hamster/Scripts/States/DebugMenu.cs, overwriteSetAndOverwriteCustomKeyThenCrash()as follows:void SetAndOverwriteCustomKeyThenCrash() { const string CURRENT_TIME_KEY = "Current Time"; System.TimeSpan currentTime = System.DateTime.Now.TimeOfDay; Crashlytics.SetCustomKey( CURRENT_TIME_KEY, DayDivision.GetPartOfDay(currentTime).ToString() // Values must be strings ); // Time Passes currentTime += DayDivision.DURATION_THAT_ENSURES_PHASE_CHANGE; Crashlytics.SetCustomKey( CURRENT_TIME_KEY, DayDivision.GetPartOfDay(currentTime).ToString() ); TestCrash(); } - Build your app.
- (Android Only) Upload your symbols by running the following Firebase CLI command:
firebase crashlytics:symbols:upload --app=<FIREBASE_APP_ID> <PATH/TO/SYMBOLS>
- Tap the Set Custom Key and Crash button, and then restart your app.
- Go back to the Crashlytics dashboard, and click into the newest issue listed in the Issues table. Again you should see something similar to the previous issues.
- This time, though, click the Keys tab in the Event summary so that you can view the value of keys including
Current Time: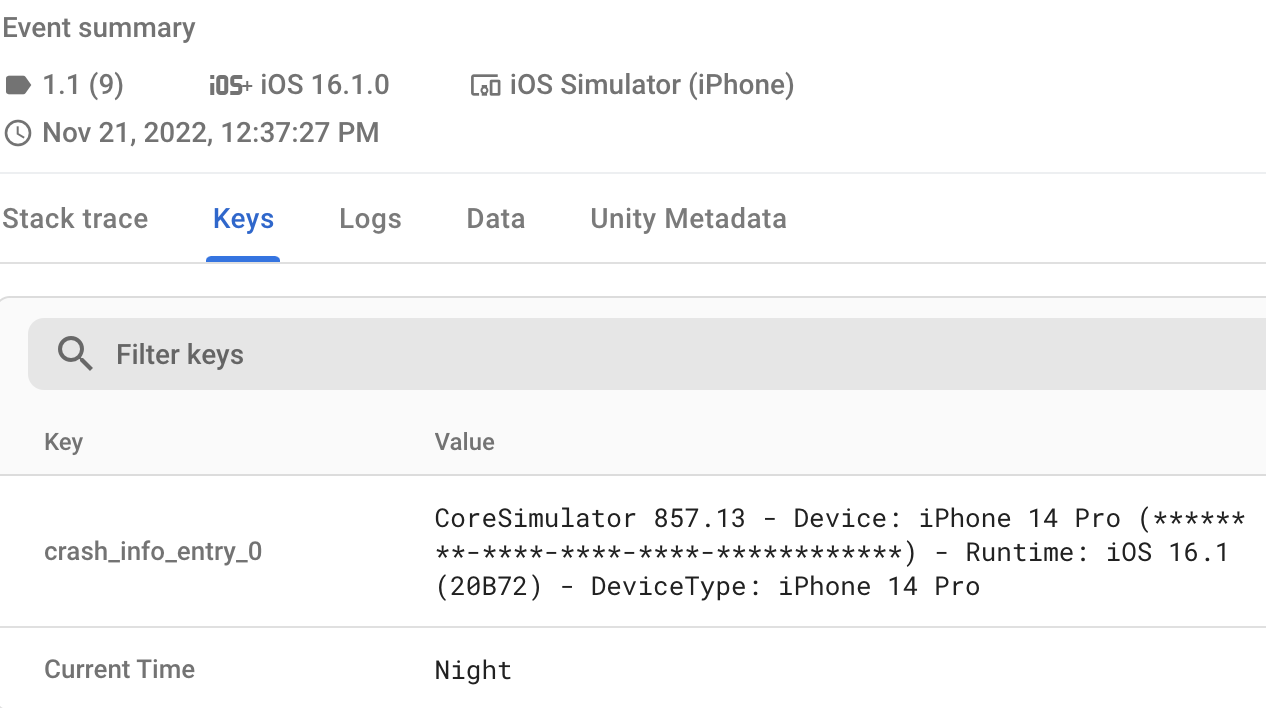
Why would you want to use custom keys instead of custom logs?
- Logs are good at storing sequential data, but custom keys are better if you only want the most recent value.
- In the Firebase console, you can easily filter issues by the values of keys in the Issues table search box.
Similar to logs though, custom keys do have a limit. Crashlytics supports a maximum of 64 key-value pairs. After you reach this threshold, additional values are not saved. Each key-value pair can be up to 1 KB in size.
11. (Android only) Use custom keys and logs to understand and diagnose an ANR
One of the most difficult classes of issues to debug for Android developers is the Application Not Responding (ANR) error. ANRs occur when an app fails to respond to input for more than 5 seconds. If this happens, it means the app either froze, or is going very slowly. A dialog is shown to users, and they are able to choose whether to "Wait" or "Close App".
ANRs are a bad user experience and (as mentioned in the ANR link above) can affect your app's discoverability in the Google Play Store. Because of their complexity, and because they're often caused by multithreaded code with vastly different behavior on different phone models, reproducing ANRs while debugging is often very difficult, if not near impossible. As such, approaching them analytically and deductively is usually the best approach.
In this method, we will use a combination of Crashlytics.LogException, Crashlytics.Log and Crashlytics.SetCustomKey to supplement automatic issue logging and to give us more information.
- In
Assets/Hamster/Scripts/States/DebugMenu.cs, overwriteSetLogsAndKeysBeforeANR()as follows:void SetLogsAndKeysBeforeANR() { System.Action<string,long> WaitAndRecord = (string methodName, long targetCallLength)=> { System.Diagnostics.Stopwatch stopWatch = new System.Diagnostics.Stopwatch(); const string CURRENT_FUNCTION = "Current Async Function"; // Initialize key and start timing Crashlytics.SetCustomKey(CURRENT_FUNCTION, methodName); stopWatch.Start(); // The actual (simulated) work being timed. BusyWaitSimulator.WaitOnSimulatedBlockingWork(targetCallLength); // Stop timing stopWatch.Stop(); if(stopWatch.ElapsedMilliseconds>=BusyWaitSimulator.EXTREME_DURATION_MILLIS) { Crashlytics.Log($"'{methodName}' is long enough to cause an ANR."); } else if(stopWatch.ElapsedMilliseconds>=BusyWaitSimulator.SEVERE_DURATION_MILLIS) { Crashlytics.Log($"'{methodName}' is long enough it may cause an ANR"); } }; WaitAndRecord("DoSafeWork",1000L); WaitAndRecord("DoSevereWork",BusyWaitSimulator.SEVERE_DURATION_MILLIS); WaitAndRecord("DoExtremeWork",2*BusyWaitSimulator.EXTREME_DURATION_MILLIS); } - Build your app.
- Upload your symbols by running the following Firebase CLI command:
firebase crashlytics:symbols:upload --app=<FIREBASE_APP_ID> <PATH/TO/SYMBOLS>
- Tap the button labeled Set Logs And Keys → ANR, and then restart your app.
- Go back into the Crashlytics dashboard, and then click into the new issue in the Issues table to view the Event summary. If the call went through properly, you should see something like this:
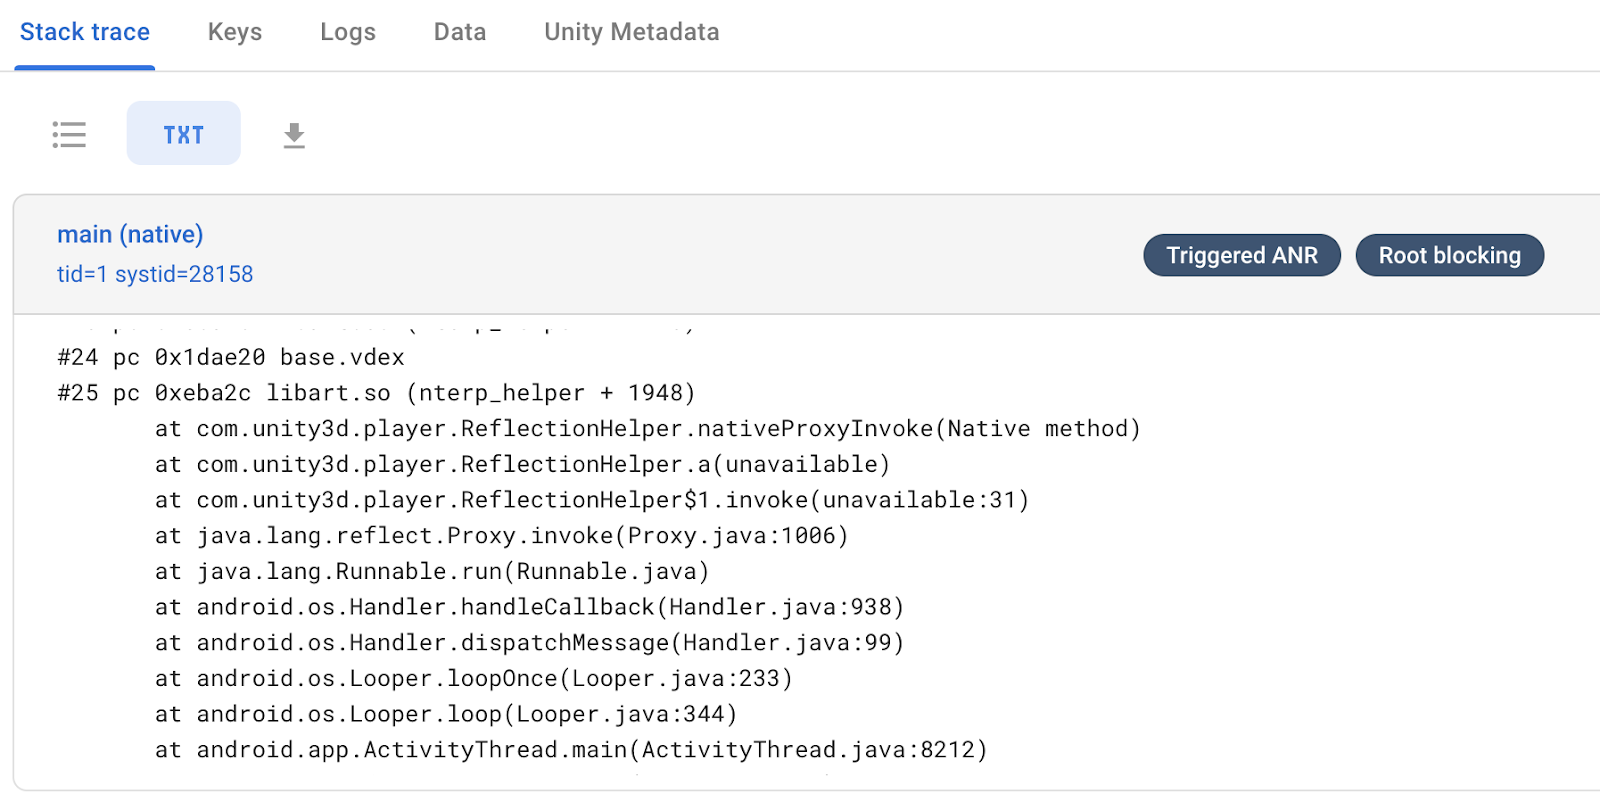
As you can see, Firebase pinpointed the busy wait on the thread as the main reason your app triggered an ANR. - If you look at the logs in the Logs tab of the Event summary, you will see that the last method recorded as complete is
DoSevereWork.
By contrast, the last method listed as starting isDoExtremeWork, which indicates that the ANR occurred during this method, and the game closed before it could logDoExtremeWork.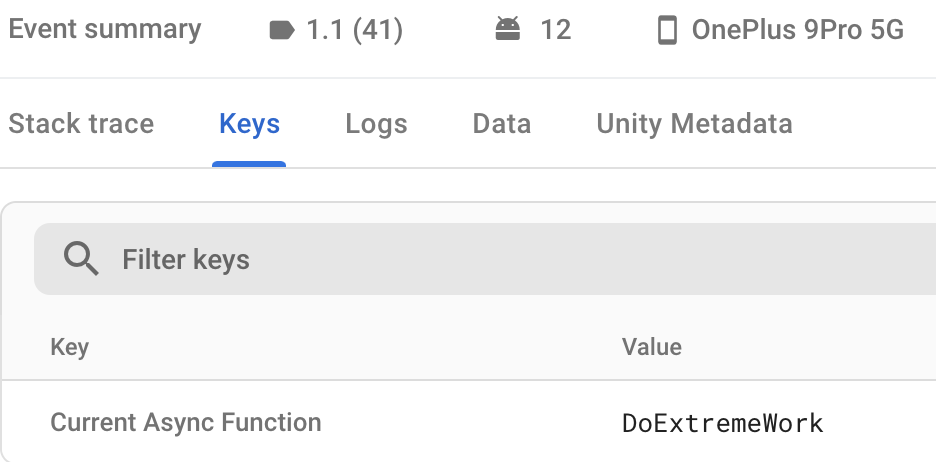
Why do this?
- Reproducing ANRs is incredibly hard, so being able to get rich information about code area and metrics is incredibly important for finding it out deductively.
- With the information stored in the custom keys, you now know which async thread took the longest to run, and which ones were in danger of triggering ANRs. This sort of related logical and numeric data will show you where in your code is most necessary to optimize.
12. Interspersing Analytics events to further enrich reports
The following methods are also callable from the Debug Menu, but instead of generating issues themselves, they use Google Analytics as another source of information to better understand the workings of your game.
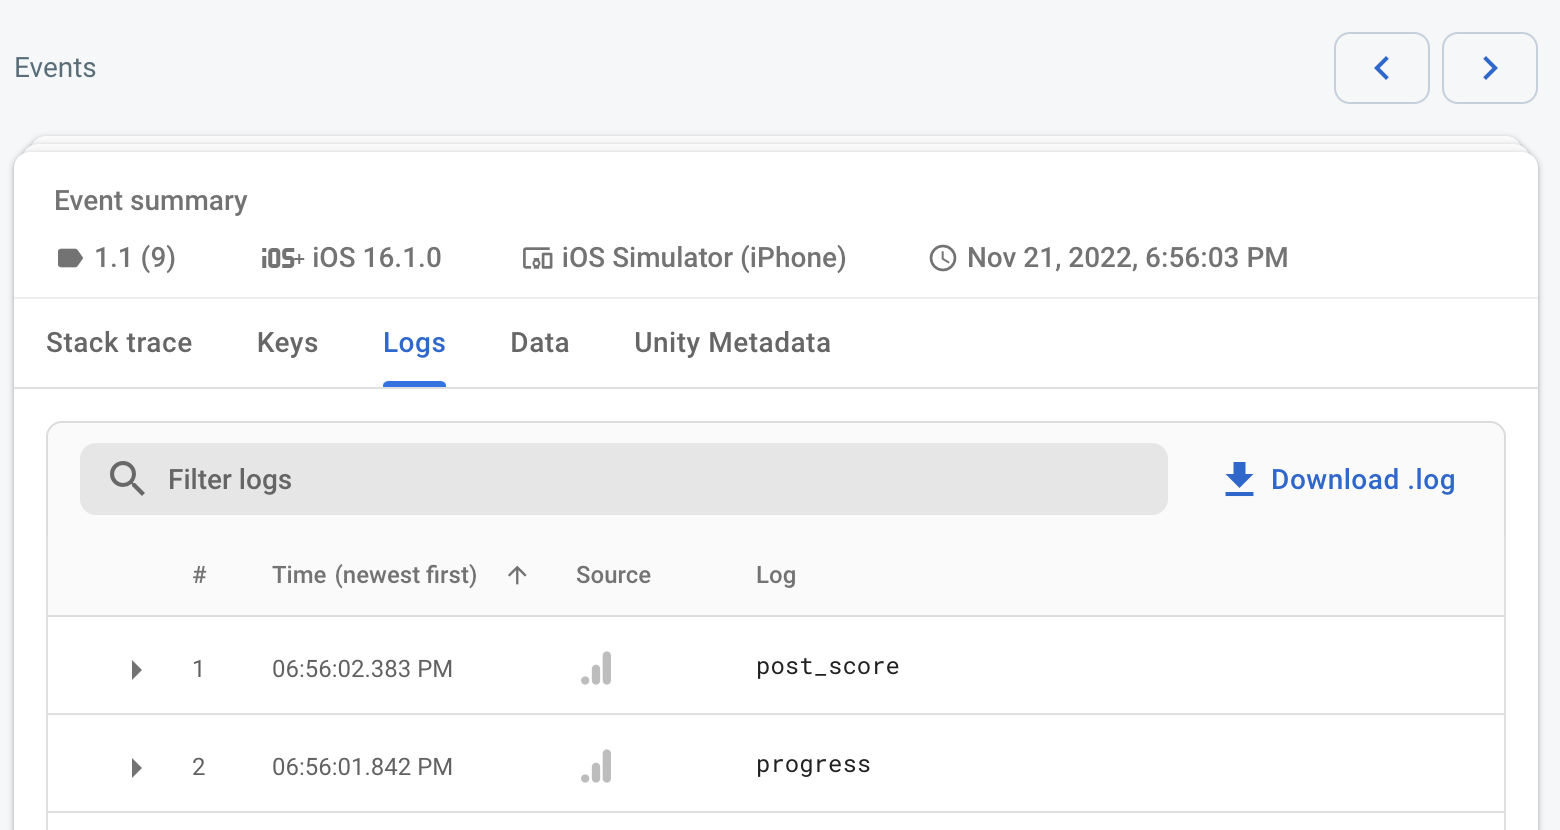
Unlike the other methods you've written in this codelab, you should use these methods in combination with the others. Call these methods (by pressing their corresponding button in the Debug Menu) in whatever arbitrary order you want before running one of the others. Then, when you examine the information in the specific Crashlytics issue, you will see an ordered log of Analytics events. This data can be used in a game to better understand a combination of program flow or user input, depending on how you have instrumented your app.
- In
Assets/Hamster/Scripts/States/DebugMenu.cs, overwrite the existing implementations of the following methods:public void LogProgressEventWithStringLiterals() { Firebase.Analytics.FirebaseAnalytics.LogEvent("progress", "percent", 0.4f); }public void LogIntScoreWithBuiltInEventAndParams() { Firebase.Analytics.FirebaseAnalytics .LogEvent( Firebase.Analytics.FirebaseAnalytics.EventPostScore, Firebase.Analytics.FirebaseAnalytics.ParameterScore, 42 ); } - Build and deploy your game, and then enter the Debug Menu.
- (Android Only) Upload your symbols by running the following Firebase CLI command:
firebase crashlytics:symbols:upload --app=<FIREBASE_APP_ID> <PATH/TO/SYMBOLS>
- Press at least one of the following buttons one or more times to call the above functions:
- Log String Event
- Log Int Event
- Press the Crash Now button.
- Restart your game to have it upload the crash event to Firebase.
- When you log various arbitrary sequences of Analytics events and then have your game generate an event that Crashlytics creates a report from (as you just have), they get added to the Logs tab of the Crashlytics Event Summary like this:
13. Going forward
And with that, you should have a better theoretical basis on which to supplement your automatically-generated crash reports. This new information allows you to use the current state, records of past events, and existing Google Analytics events to better break down the sequence of events and logic that led to its outcome.
If your app targets Android 11 (API level 30) or higher, consider incorporating GWP-ASan, a native memory allocator feature useful for debugging crashes caused by native memory errors such as use-after-free and heap-buffer-overflow bugs. To take advantage of this debugging feature, explicitly enable GWP-ASan.
Next Steps
Proceed to the Instrument your Unity game with Remote Config codelab, where you'll learn about using Remote Config and A/B Testing in Unity.
